
In cleanrooms, high ventilation rates are being used. This is in line with the available guidelines. Normally the required air flows are applied 24/7 so the environmental cleanliness is not compromised. This, therefore, is an energy-intensive activity. As production is of higher economic importance than energy savings, cleanroom operators have put product safety and product yields first, giving energy efficiency a lower priority.
The study described in this article challenges the applied air change rates and more specifically the need for applying these rates 24/7. These are taken from real-life examples of pharmaceutical cleanrooms.
Occupancy control is considered most practical and effective
The need for high air change rates in cleanrooms depends partly on the type of usage and time span. As a result, at the moment, a GMP B room consumes up to 25 times more energy than a non-classified room. Is the ventilation rate used representative? Often this is still a question. Actual particle generation generally remains an uncertain parameter during the design process. Therefore an engineer will build in some safety margins with regards to the capacity.
So how?
To optimise the air change rate in cleanrooms, while maintaining the same air quality performance, several options were investigated: night reduction, particle concentration controlled ventilation and occupation-based controlled ventilation.
The main research question was to what extent energy use reduction is possible when applying adapted air change rates in current and future cleanrooms. In this research, attention is on pharmaceutical cleanrooms. The research is part of the graduation work of the first author at the Eindhoven University of Technology.
In order to answer the research question, measurements were carried out in various GMP (pharmaceutical) cleanrooms. These measurements were carried out over a longer period and with different occupations.
A full description of the method applied can be found in the paper "Ventilation efficiency improvement in pharmaceutical cleanrooms for energy demand reduction". In addition, a simulation model was developed based on the paper "The application of the ventilation equations to cleanrooms Part 1: The equations," to investigate the particle concentration when applying different air change strategies.
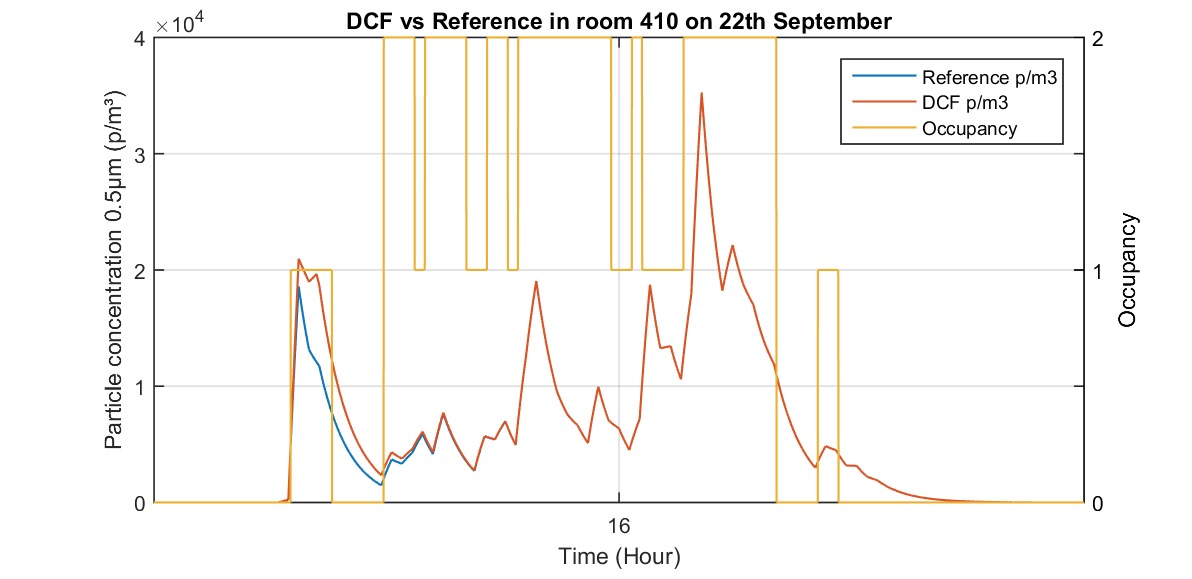
Figure 1 shows a typical result for the measured particle concentration as a function of time. Results of two particle counters (PC1 and PC2) are displayed, as well as the cleanroom occupation as a function of time. The number of persons at a given moment can be read from the right-hand axis. This cleanroom was designed for GMP C. Therefore the particle concentration during use should not exceed the value of 3.5 x10⁶ particles/m3 [>0.5 µm].
In Figure 2 the distribution of the particle concentration in the cleanroom as a function of the number of people in the cleanroom was derived from the measurement data for one of the cleanrooms. This is shown in a box plot. Outliers are shown by the 'dots'.
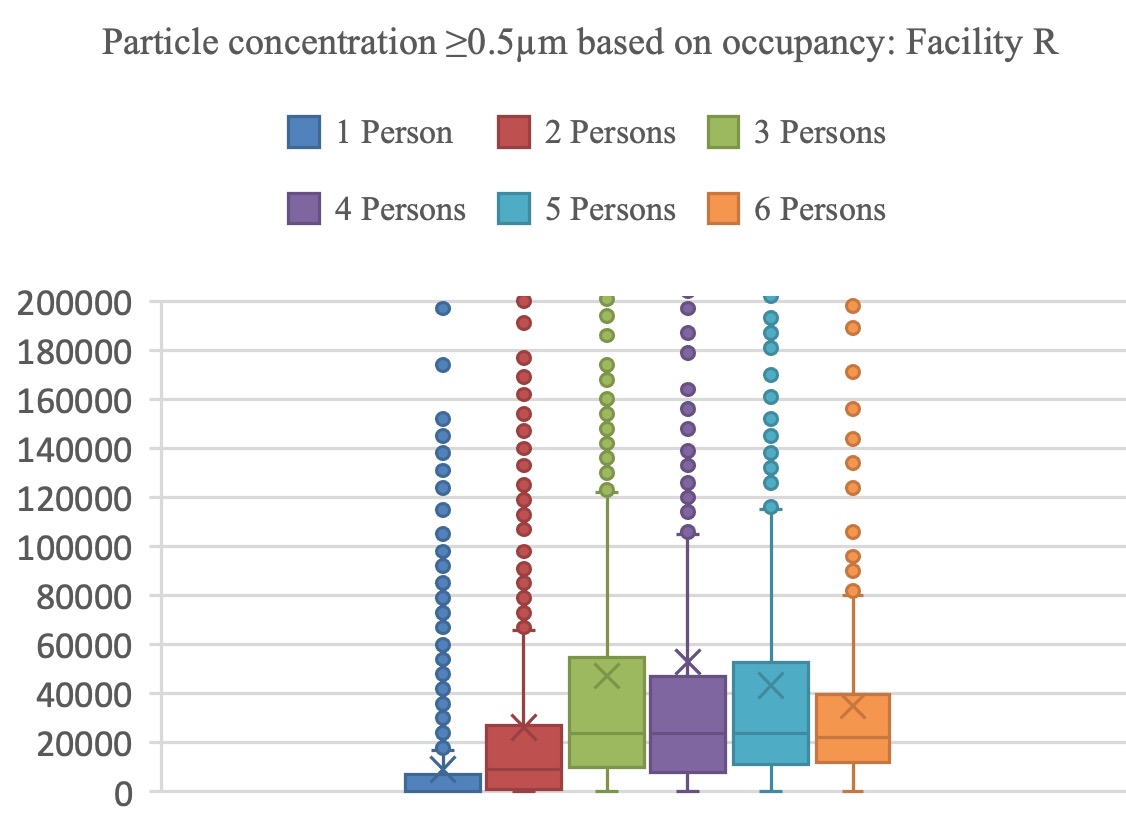
Figure 1 shows that particles only are measured when there is human activity in the investigated cleanroom. In general, the measured concentrations remained one order magnitude lower than required according to GMP. The peaks indicate that the source position and transient activities can result in a non-uniform contaminant distribution. This is representative of the other cleanrooms that were measured as part of this study.
When everybody has left the cleanroom, the particle concentration reduces to zero within 20 minutes (theoretically this depends on the recovery time, based on the air change rate used). In all investigated GMP rooms, a near-zero particle concentration (particles >0.5 µm) is measured when no employees are present in the room. This shows that for the investigated cases the persons in the cleanroom, and their activities at that time, are the only sources of contamination.
Cleanroom operators have prioritised product safety and yields above energy efficiency
This, of course, is important to confirm when consideration is being given to adapt the ventilation rate.
Figure 2 shows that the particle concentration does not show a linear correlation with the number of persons in the room. An increase from 3 to 6 persons does not lead to significant differences in the particle concentration. A possible explanation for this outcome is that at the beginning and end of a shift people are starting up and cleaning up (in this case) the production. Because not everyone starts or stops at the same time, fewer people may be present in the cleanroom when starting up or cleaning up. During these activities, however, it is likely that more particles will be produced, for example, because of walking. This can be seen in Figure 1. At the end of the day, when only one cleaner is present, relatively high particle concentrations are measured.
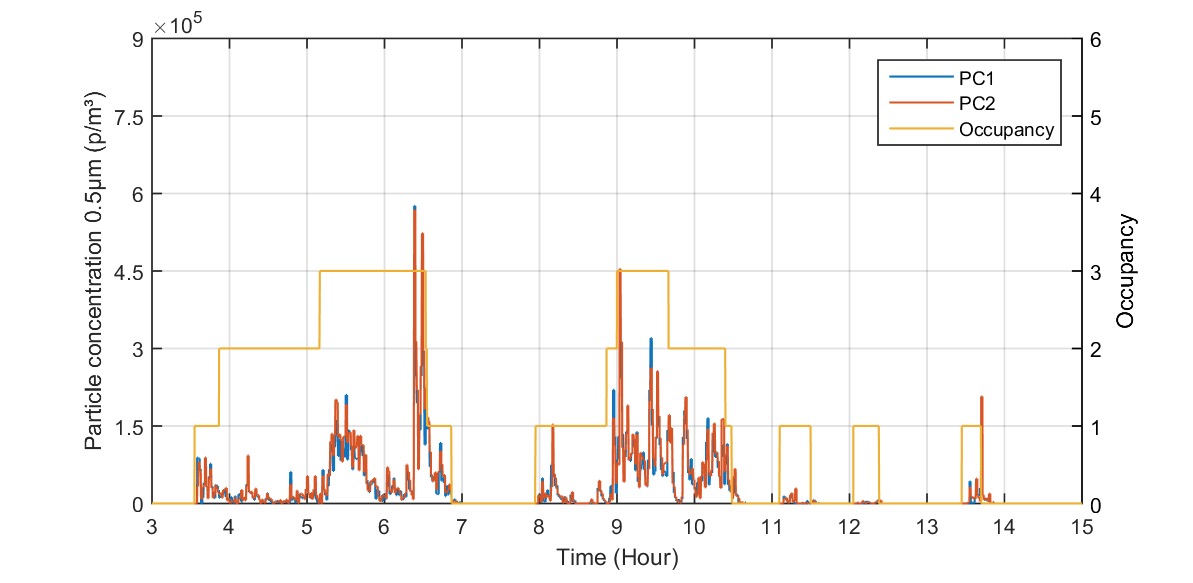
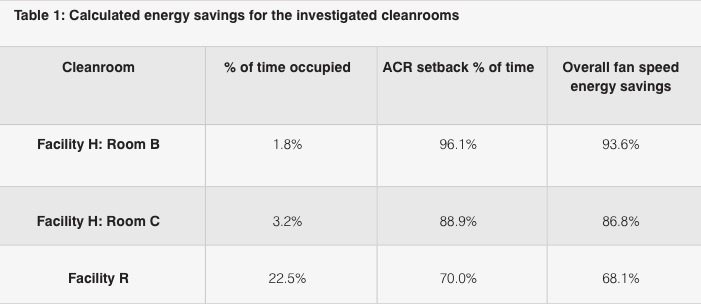
Figure 3 shows an example of a simulation result using Demand-Controlled Filtration (DCF) based on information obtained from the measurements (Reference). For the simulation case (DCF) the design value air change rate (20 h-1) was applied when the cleanroom was occupied, regardless of the number of persons present. When empty, an air change rate of 6 h-1 was applied instead, starting 30 min after the occupancy sensor indicated no presence of persons in the room. This ensures that, with the given ventilation rate, the particle concentration returns to zero. The important assumption, which was confirmed from the measurements, is that the persons in the room and their activities are the single sources present. Also, sources from outside are assumed negligible. Table 1 shows the potential energy savings when this strategy is applied to the various cleanrooms that were investigated. The energy savings only refer to the savings in fan energy. The outcome will also positively affect the energy required for conditioning the supplied air.
Takeaways
Figure 3 shows that demand-controlled filtration can keep the performance of the cleanroom at the desired cleanliness level, similar to full-time ventilation. However, at the start of occupation, a higher concentration is calculated than in a continuous situation. This relates to the time required to control the system to the desired (designed) level. For the case shown, it takes 150 seconds for the system to achieve the desired ventilation rate.
Based on the assumption that demand-controlled filtration is possible, Table 1 shows that significant energy savings are possible. These savings of course have a close relationship with the use-time of the cleanroom and certainly appear interesting for the investigated pharmaceutical cleanrooms.
To emphasise, these savings can be achieved while maintaining the cleanroom's performance in terms of air quality.
Instead of control based on presence, the air change rate can also be directly based on the particle concentration in the cleanroom. The measurements indicated that it was not always possible to correlate a significant increase in particle concentration with an increase in the number of people present in the cleanroom. The particle concentration usually is measured locally using a particle counter with a relatively low flow rate (0.1 cfm). This means that locally higher or lower concentrations can be measured which may not be representative of the room as a whole. This is caused, among others, by the ventilation efficiency and the position of the source(s) in the room. In addition, the measured concentration fluctuates regularly as a result of the (transient) activities (see peaks in Figure 1). This may result in unstable or delayed control.
Up to 90% energy savings are possible for the investigated pharmaceutical cleanrooms
Controlling the ventilation rate based on occupation, therefore, seems to be most straightforward and effective at the moment. Implementation is simplified when light motion sensors for the lighting already are installed. This system then can also be used to achieve the desired ventilation rate. After half an hour, for example, in which no detection of people has taken place, ventilation can be reduced to a lower level. In this way, the recovery time (typically <20 min for such a room) is also taken into account and the cleanroom continues to function according to the requirements. When applying this solution, an active pressure control must be present in the cleanroom to maintain the pressure hierarchy. This must be guaranteed, even when not in use, to prevent contamination from outside.
Reducing energy consumption for ventilation (and recirculation; DCF) through occupancy-based control is particularly effective in rooms that are only used for certain production processes and therefore have regular and slightly longer interruptions in occupancy.
In this investigation, it appeared that a GMP B room was only in use for 1.8% of the time during the measurement period. Meanwhile, the room was continuously ventilated at 40 h-1. Saving more than 90% on energy consumption, in this case, seems straightforward. In the investigated cleanroom facility that had a more normal occupancy pattern of 40 hours per week, energy savings of 68% on the fan consumption remains possible. It should be noted that these savings are based on the monitor data for particle size >0.5 µm.