Cleanrooms consume large amounts of energy – anything from 2 to 50 times more than is consumed by non-classified areas, depending on each specific application. In the past, little attention was paid to energy consumption and over-specification and over-designing of facilities, often based on normative documents or a poor interpretation of them, was common.
Existing international standards tend to be general and do not reflect the specific features of cleanrooms
Existing international standards tend to be general and do not reflect the specific features of cleanrooms. Detailed guidance on how to save energy in cleanrooms can be found in two national standards – the British standard BS 8568:20131 and the German VDI 2083 standard2 – but the issue is complex and not thoroughly investigated, therefore further efforts to understand energy consumption are required.
Special attention needs to be given to reducing air change rates (ACRs) and to considering real particle generation in cleanrooms to determine the actual ACRs needed once ‘in operation’. Energy consumption grows rapidly with an increase in cleanliness levels. It is difficult to make a general estimation, but practical examples show that power required for cleanrooms can be orders of magnitude greater than for non-classified rooms, depending on the class of cleanliness (see Table 1).
| Table 1: Examples of energy consumption for different facilities | ||
| Class | Power, kW/m2 | % Increase in consumption |
| Non-classified | ||
| 8 ISO | ||
| 7 ISO | ||
| 6 ISO | ||
| 4/5 ISO | ||
| Non-classified | ||
| D | ||
| C (laboratory) | ||
| Non-classified | ||
| D | ||
| C | ||
| B | ||
Of course, ACR depends also on heat load, local exhausts, personnel present, etc., which vary for different processes. But the trend is clear: energy consumption grows dramatically from one cleanliness class to another, and it can vary depending on ACR, recovery time and other factors that are discussed later in this article.
Energy saving methods
Energy saving methods can be both general (as applied to all kinds of premises and buildings) or specific to cleanrooms. General methods focus on:
- minimising heat gain/losses and providing heat isolation of buildings
- air recirculation with as little outdoor air as possible on safety grounds
- siting plants in climate zones where high power in winter/summer is not needed
- use of high efficiency ventilators, AHUs and chillers
- use of equipment (HVAC units, filters, etc.) with reserve power, (as bigger nominal power consumes less energy)
- avoiding unnecessary narrow tolerances for temperature and humidity
- removal of excess heat load from process equipment by local in-built means.
Specific methods consider cleanroom features and include:
- reducing cleanroom size to a minimum
- avoiding over-specification of cleanliness class
- use of HEPA filters with reduced pressure drop
- sealing all leaks
- local protection where higher cleanliness class is maintained in a limited area as required by a process
- minimising number of personnel and using technologies that don’t require people (closed systems, RABS, isolators)
- careful attention to operation, garments, hygiene, training, etc
- reducing air flow rate when ‘at rest’
- avoiding over-specification of ACRs and recovery time
- determining actual required air flow rates during testing and operation and setting ACR based on these data
Energy consumption factors differ for unidirectional and non-unidirectional flows. For unidirectional air flow the key factor is air velocity. The GMP guidance specifies 0.36–0.54m/s (0.45 ± 20%) now. But where did 0.45m/s come from and what is the rationale behind it?
Metric 0.45m/s are equal to 90ft/min. This number was included in an early version of US Federal Standard 209B (1973). It was very approximate and reflected the level of knowledge at that time. Later on, it was discussed in many publications that 0.45m/s was over-specifying and 0.3m/s was considered enough; as a result, the 0.45m/s norm was excluded from the next revision of Fed. Std. 209C (1987). Non-GMP areas of cleanroom application follow this rule successfully but the figure of 0.45m/s carried over into the GMP guides and has remained there ever since.
For cleanrooms with non-unidirectional air flow ACR is the key factor, but as the picture is more complicated, it requires a more detailed analysis. High air flow in HVAC systems that provide rooms with the required ACRs are the main cause of the huge energy consumption. Cleanrooms with non-unidirectional (turbulent) air flow make large demands on air ventilation, heating, cooling, humidification and drying.
It is not really possible to give one formula because energy consumption depends on too many variables
Different sources of information present different figures for how ACRs affect energy consumption. BS 8568:2013 (item B.15)1 says: ‘Air volume is proportional to the cube of the fan power, i.e. a halving of the air volume reduces the fan power to one eighth’ or a 50% reduction on flow gives an 88% reduction in power. Other publications give less difference.
In fact, it is not really possible to give one formula because energy consumption depends on too many variables. Therefore, it is worth making a short analysis for a facility at the design stage to estimate how ACR influences the power required. Table 2 shows an example for a facility in the Moscow region. For this real facility halving the air flow reduces the energy consumption by 25–30%.
| Table 2: Power consumption for cleanrooms in non-sterile ointments facility | |||
| Energy consumer | |||
| 1 | Ventilators in HVAC system | ||
| 2 | Air heating: | ||
| – hot water (1st stage) | |||
| – electric heater (2nd stage) | |||
| 3 | Cooler (electric power) | ||
| 4 | Steam humidification | ||
| 5 | Total consumption: | ||
| – winter: hot water | |||
| – electric power | |||
| – summer: electric power | |||
The ACR required can depend on many factors: the volume of outdoor air required for hygiene reasons (breathing); compensation of local exhausts; maintaining pressure difference; removal of heat loads; and providing necessary cleanliness (cleanroom class). All these factors should be taken into consideration at the design stage. ACR should be chosen for the ‘worst case’ scenario or the largest value (see Figure 1).
It is important to pay attention to cases where the ACR for heat load removal or compensation of local exhausts exceeds the demands for the cleanliness class. It indicates over-specifying of heat load (see below) or justifies the application of closed systems (isolators, RABS) with much reduced exhausts.
| Example of poorly specified heat load |
| Energy wastage because of poorly specifying equipment heat load can be large. There was a case of a supplier of nanotech equipment that indicated a 24kW heat load from a process machine in the specification for cleanroom design. The HVAC engineer took it as a basis and calculated huge energy consumption and sizes of HVAC unit. An AHU supplier made an offer and the civil engineers constructed a large technical room. |
| When the project manager examined the spec and looked for unusually high numbers he found that the 24kW referred to start-up or changing operation mode, which might happen once every six months when process and personal are absent. Heat load during normal operation was about 2kW. This correction dramatically changed the HVAC design and reduced energy consumption. |
| The moral – pay attention to unusual values and find out what is the reason for them. Don’t hesitate to ask why if something looks unusual or is unclear. |
What ACR is needed?
Today most normative documents do not specify exact numbers for ACR, leaving it to designers. But some documents do give a figure. The most common requirement is 20 changes per hour (20h-1).
The development of the norms for ACR has its history: in the late 1950s, the US set requirements for ACRs in surgical suites at a minimum of 20h-1 in existing facilities and a minimum 25h-1 in new ones. Probably the first mention of 20h-1 was in the early version of Federal Std. 209B. It reflected the practice in the 1960s. Later this norm was withdrawn from Fed. Std. 209 because it was understood that the required cleanliness level can be achieved with a lower ACR. The task of determining ACR was left to the facility designer.
FDA Aseptic Guidance copied 20h-1 in 1987 for supporting rooms, even though it was excluded from the original Fed. Std. 209, and this was not corrected in 2004 when this guidance was re-edited.3
Today, FDA requirement for 20h-1 for supporting rooms (8 ISO in operation) is still in force: ‘For Class 100,000 (ISO 8) supporting rooms, air flow sufficient to achieve at least 20 air changes per hour is typically acceptable. Significantly higher air change rates are normally needed for Class 10,000 and Class 100 areas’. So for ISO Class 7, this Guidance requests an ACR even greater than 20h-1.
The early GMP EU Guide had this norm but it was cancelled in 1997. It is worth saying that this did not change matters much because the conservative requirement for recovery time of 15–20 minutes remained (see Tables 3 and 4).4
Many practitioners follow the ISPE Guidelines that recommend 20h-1 for sterile processes (both aseptic and terminal sterilisation): ‘Generally, air changes of at least 20h-1 are expected in Grade 7 and Grade 8 rooms’ (ISO 7 and ISO 8 respectively) – item 5.5.3.5
The recent World Health Organisation (WHO) report No. 961, Annex 5 also specifies ACRs for non-sterile dosage forms: ‘4.1.6 Air change rates are normally determined by the following considerations (could normally vary between 6 and 20 air changes per hour) ...’6, which could be regarded as a step forward, but the same report specifies strict values for recovery time: 20min (item 4.1.10) and even 15min (item 8.2.14, see Table 3). The WHO report gives 6–20h-1 as a general idea but does not explain what to choose when.
| Table 3: Requirements for air change rates in different guides | |||
| Non-sterile products | |||
| Aseptic | Terminal sterilisation | ||
| FDA Aseptic Guidance | |||
| GMP EU | |||
| ISPE | |||
| WHO | |||
The old conservative value of 20h-1 is therefore still present in documents (Table 3). The 20h-1 ACR refers mostly to sterile production, but some designers opt to use it in non-sterile cases too.
Sometimes 20h-1 travels from the ‘in operation’ requirement (ISO Class 8) of FDA Aseptic Guidance to zone D where ISO Class 8 is specified for ‘at rest’ condition only and no requirements exist for ‘in operation’ at all!
GMP EU talks about a 15–20 minute recovery time for sterile production and does not differentiate between aseptic processes and those with terminal sterilisation, setting 15–20 minutes recovery time for both. But these cases are different in principle and it is obvious that norms for aseptic and terminal sterilisation processes should not be equal. The same is true for different stages of aseptic processes: the stages before sterilising filtration can have lower requirements than the aseptic core.
Figure 2 shows curves of reducing particle concentration following the start-up of operation. The required cleanliness class can be maintained easily for different values of ACR, even for a rate of 5h-1. All curves tend to a constant value, which is quite good for this cleanroom. However, what is important is that the ACR depends not only on the cleanliness class but also on the recovery time.
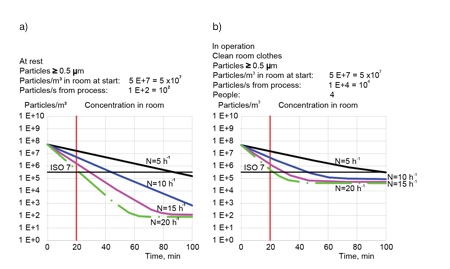
Figure 2: Reducing of particles concentration in zone C after start-up
Graph a) shows ‘at rest’, particles generation 100 particles/s, no personnel present; graph b) shows ‘in operation’, particles from process 10,000 particles/s with four persons (10,000 particles/s from each human)
Recovery time
ISO 14644-3:20057 says that recovery time is the time required to decrease the initial concentration of particles by a factor of 100 (100:1 recovery time). Some other guides describe it as the time taken to achieve cleanliness level for the ‘at rest’ state after a short clean-up period after completion of operation.
Normally, it is deemed that recovery time should be 15–20 minutes (Table 4). The strictness of these requirements depends on the risk to the products. This risk is dramatically different for preparation stages (sterilising filtration, dry-heating of glassware) and the final operations (filling, stoppering etc.).
| Table 4: Requirements for recovery times in different guides | ||||
| Non-sterile products | ||||
| Aseptic, before or after sterilising | Terminal sterilisation | |||
| Before | After | |||
| GMP EU | ||||
| ISPE | ||||
| WHO, TR 961 | ||||
Just as 20h-1 were in Fed. Std. 209 and moved to FDA Guidance for aseptic only, and then spread, the same situation applies for the recovery time of 15–20 minutes, creating one of the main reasons for the over-design and unnecessarily high energy consumption of cleanrooms. Increasing recovery time to 20–40min allows one to reduce the ACR from 20h-1 to 10h-1 or to reduce energy consumption by 25% (Figure 3).
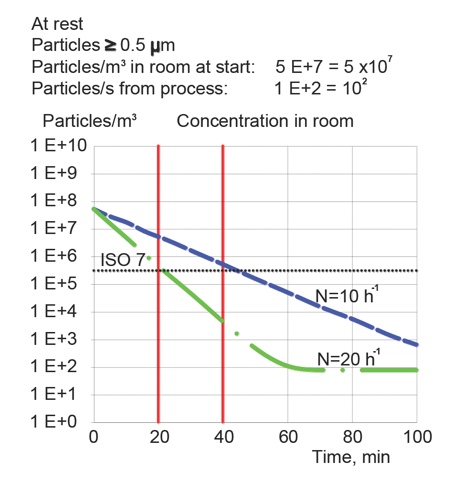
Figure 3: It is possible to reduce air change rates if recovery time is increased
One further curious thing: GMP or cleanroom regulations do not differentiate between ‘start-up’ period and stabilised ‘at work’ periods. As a general rule, energy consumption for a start-up period is much greater than for a steady period. Why then, are cleanrooms required to work with a large ACR after reaching a stabilised period? Why not switch a cleanroom on 40–60 minutes before the start of process to reach a stabilised period and use less energy?
There may be a concern that an explosion of particles could happen during this process and thus 15–20 minutes are necessary. But monitoring and frequency control of fans are now widely in use; a quick check for sudden particle emission can easily be achieved, and switching the AHU on to full capacity can remove the contamination. Monitoring can be arranged even for classes ISO 8–6 to keep the process under control.
Clothing
Clothes have great impact on ACR. Dr B Reinmüller and Prof B Ljungqvist made detailed investigations of particle generation by personnel dressed in different types of clothing. Figure 4 illustrates (in numbers rounded to simplify the illustration) the difference between ordinary cleanroom clothes (jacket and trousers) with the generation of 10,000 particles/s; and good cleanroom clothing (overalls) with particle generation of 1,000 particles/s. This shows the great improvement in air cleanliness when using good cleanroom gowns. It is possible to reduce the ACR from 20h-1 to 10h-1 by improving the quality of garments, without other expense.
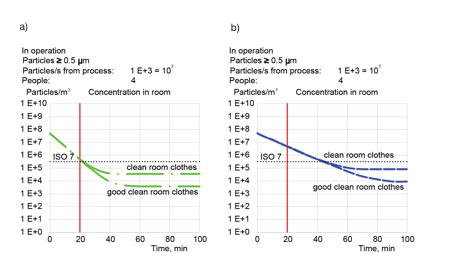
Figure 4: Reducing particle concentration for different types of clothing: a) air change rate 20h-1; b) air change rate 10h-1
The gap between cleanliness classes ‘during design’ and ‘in operation’
Cleanroom class depends on many factors during the design, construction and operation stages. It is not good practice to compensate for particle generation from poor clothes and badly trained or controlled personal by increasing ACRs. On the contrary, it is worth using high quality clothes and maintaining good hygiene, even for ISO Classes 7 and 8.
Particle concentration has a statistical nature that is difficult to consider at the design stage. Real particle generation is normally unknown at the design stage, therefore cleanroom designers prefer to guarantee cleanroom class through over-design. In fact, this is seen to help compensate for poor operation. As a result a cleanroom normally has a ‘reserve’ of cleanliness. Existing practice of cleanroom testing and operation does not take into account this reserve. Over-use and, thus, a waste of energy is the result.
This article puts forward a different approach: a cleanroom should be tested to determine reserves; these reserves should be considered ‘at operation’ and the cleanroom should work at minimum capacity. Routine testing and good operational practice should help this work. Because bad operational practice exists in some cleanrooms, people contaminate the cleanroom more than necessary then try to clean the air by increasing the ACR.
Therefore a flexible approach for defining cleanroom parameters is required. An estimation of energy consumption should be carried out at three stages:
Design – to take into account necessary hygiene and safety issues, local exhausts, heat loads and to estimate ACR with reasonable margin;
Testing – to determine real particle generation and to learn how big the margin is without making process worse;
Operation – to consider the margin and to operate the cleanroom at reduced capacity; to follow good operational practice; to monitor air cleanliness and to make a trend analysis. It is also worth estimating real particle generation during operation with trend analysis and monitoring in zones C and D (ISO 7/8 classes) and not only A and B. These data can be provided as the proof for maintaining low ACRs.
References
1. BS 8568:2013 ‘Cleanroom energy – Code of practice for improving energy efficiency in cleanrooms and clean air devices’
2. VDI 2083 Blatt 4.2 Reinraumtechnik – Energieeffizienz. Beuth Verlag, Berlin (April 2011)
3. Guidance for Industry. Sterile Drug Products Produced by Aseptic Processing – Current Good Manufacturing Practice. FDA, USA. 2004
4. EU Guidelines to Good Manufacturing Practice. Medicinal Products for Human and Veterinary Use (GMP EC). 2010
5. ISPE Baseline Guide: Sterile Product Manufacturing Facilities, Second Edition, September 2011
6. WHO Technical Report Series, No. 961, 2011
7. ISO 14644-3:2005 Cleanrooms and associated controlled environments - Part 3. Test methods