
When operating cleanrooms, one routinely performs monitoring of quantities such as temperature, humidity and airborne particle counts. The conventional airborne particles down to, for example, 0.5µm are monitored using laser particle counters, as these tiny particles remain aloft in the air for long periods of time and are moved with the air currents.
Today, one factor that is less well addressed is that of particle fallout or PFO. This occurs when larger particles are generated, with sizes often greater than 5µm, and trip out of the atmosphere on to surfaces.
Such particles could be present in the cleanroom and may be very large; up to and beyond 100µm, fibres for example, and these will not be monitored by airborne particle sensors. These larger particles do not stay aloft on the air currents for long and often fall from the generation site.
Particle fallout is of particular concern to industries whose products have surfaces that are susceptible to particulate contamination; semiconductor and optics industries for example. The ECSS-Q-70-50-C standard defines the particle monitoring of spacecraft systems and their cleanrooms for assembly, to help ensure control of particulate contamination for sensitive instrumentation and systems.
The primary source of large particles is often human activity in laboratories and cleanrooms, although not exclusively, as machinery and vibrations can generate particles.
The size distribution of particles follows a power law, as indicated in the plot of real data measured in a cleanroom shown in Figure 1.
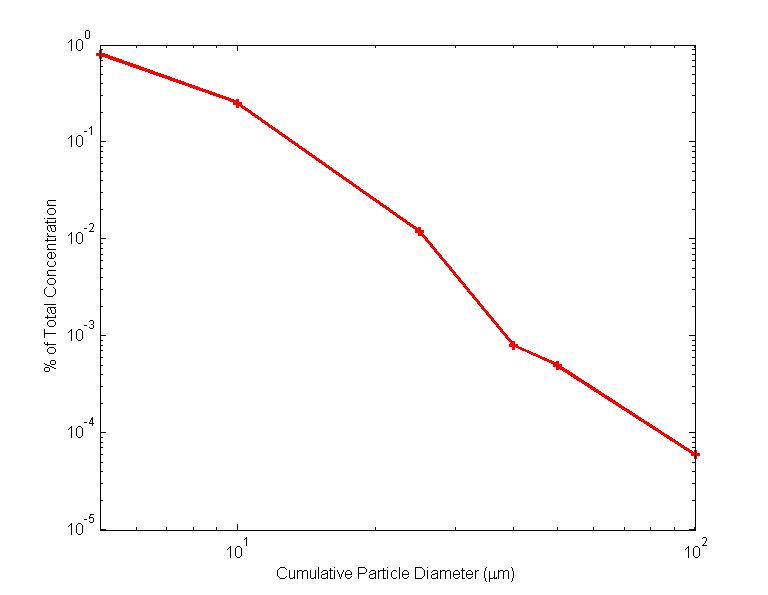
Figure 1
Conventionally, PFO in the cleanroom environment is monitored by techniques such as witness plates where, for example, silicon wafers are left in strategic positions to collect particle fallout and are then collected manually and taken to monitoring sites where an optical system is used to count the particles on the witness plates.
Such systems have high latency between the events leading to particle fallout in the cleanroom and the subsequent monitoring; with time between samples lasting from weeks to months, depending on sample frequency.
Newer instruments are capable of monitoring particle deposition in real time, such as the APMON instrument from TNO, and the PDM instrument of SAC. However, these existing instruments and techniques tend to be limited to monitoring particles of >25µm in size, thereby missing the 5µm-25µm range, which contains the bulk of the particles (>90% by number) that contribute to PFO and can cause problems with products and systems.
Monitoring innovation
XCAM has developed a real-time particle fallout monitor based on CMOS image sensing technology. It monitors the shadow created by particles when they fall onto the sensor (patent pending GB2553830 and WO2018/051101).
The shadows of the particles can be created, either by the cleanroom lighting or by the unit's inbuilt LEDs, to cause the shadowing for use in areas where the natural light is at too low a level.
The new PFO 1040 unit (see Figure 2) uses four CMOS sensors, each with an area of greater than 1 cm2; it can provide a measurement with a high cadence, with a sampling frequency down to ~1 minute, to track the accumulation of particles. In routine use, we typically use a sampling period of around every 1-4 minutes, providing virtually real-time monitoring of the status of particles that have fallen onto the sensor.
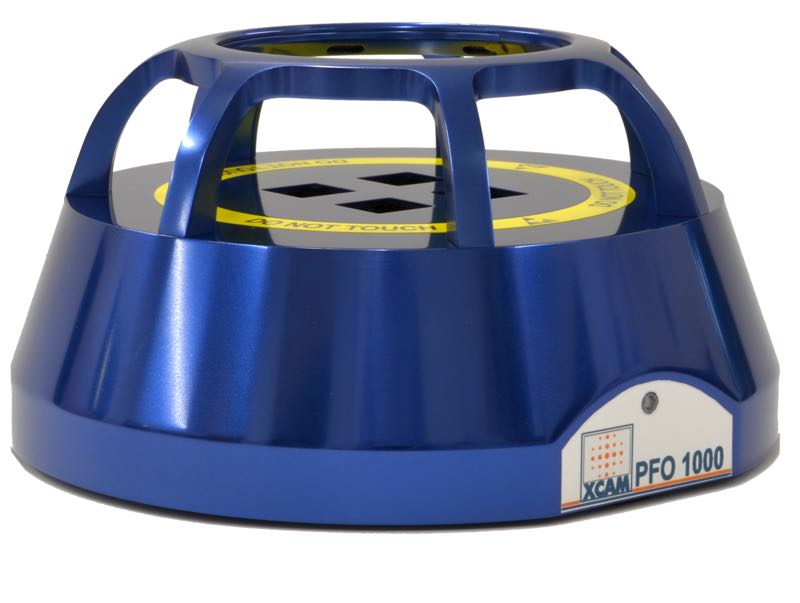
Figure 2
Figure 3 shows one such PFO unit in active use in the laminar flow bench of a cleanroom, where a filter wheel is being assembled for a high-value space instrument. The presence of the PFO monitor can provide cleanroom monitoring with an assessment of both the general trend in cleanliness and PFO in the working area and can highlight when specific operations or operators may cause an issue.
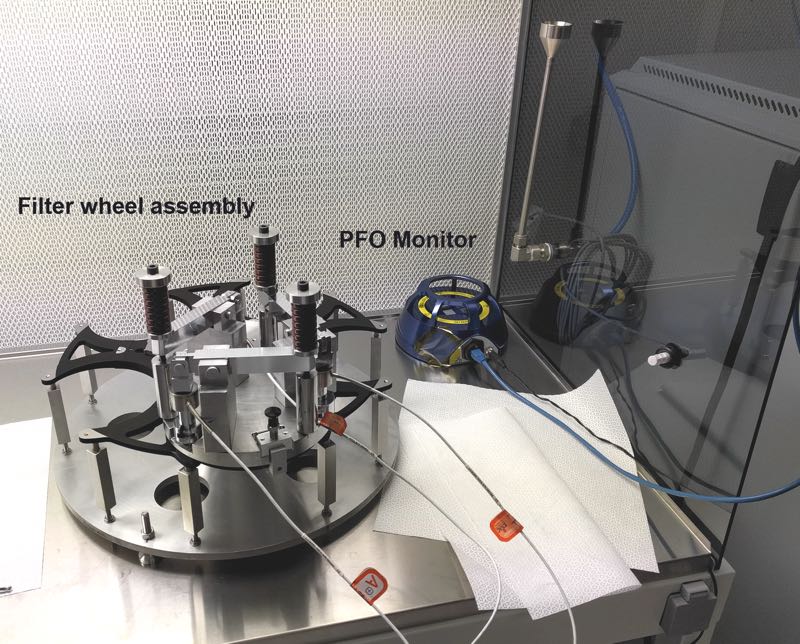
Figure 3
Figure 4 shows a typical image from one of the PFO sensors being operated in a standard laboratory (not a cleanroom) after many particles and fibres (e.g. from clothing) have fallen onto the sensor (left), and where the automatic software has classified items detected in the image (right) and annotated them with boundary limits using colours aligned with the classification of the particle type.
Identified PFO objects may be categorised into classes of:
- Small particles
- Large particles
- Straight fibres
- Curly fibres
- Remaining unidentified items

Figure 4
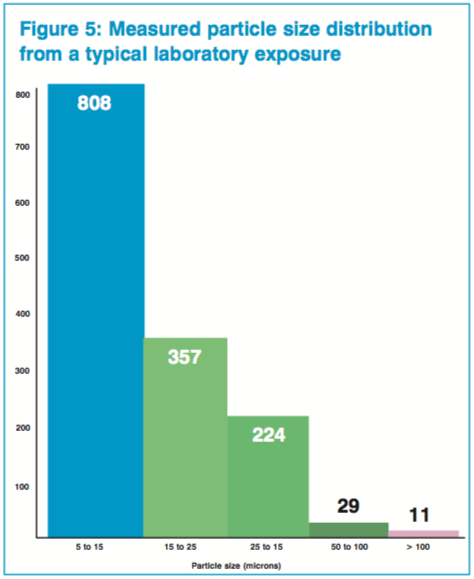
In the analysis, we define fibres as being categorised when a particle has an aspect ratio (length/width) of greater than 10:1. These classified particles can then be used to build up a particle size histogram to feed into estimates of the PFO and the percentage area covered (PAC). As can be seen from Figure 5, the size distribution follows a power law with the occurrence of smaller particles being much more frequent than larger ones, matching the power law rule described earlier and depicted in Figure 1.
Through its real-time monitoring and high cadence, down to 1 minute per sample, the PFO 1040 has been demonstrated to monitor cleanrooms where, for long periods of time in the absence of human activity, no change in the PFO is reported. However, the presence of human activity in the vicinity can produce a rapid increase in PFO, which can be tracked as a growth in PFO over time; some singular events such as operations close to the unit can result in large increases in PFO being monitored, and subsequently correlated to the specific operations being performed in the monitored area.
Such an example of monitoring is shown in Figure 6. In this instance displaying the per cent area covered (PAC) during a working day. To accelerate the measurements, these results were taken in a standard laboratory with filtration in the air conditioning – but not a cleanroom, which would have taken much longer to accumulate the same trend in PAC.
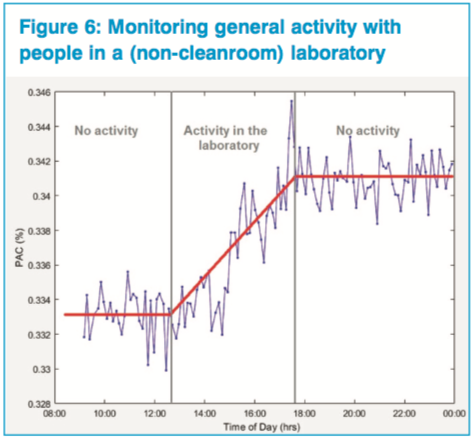
We can clearly see the periods when the laboratory was devoid of people in the early morning and evening on this particular occasion; however, during the afternoon between noon to 6pm the measured contamination increases steadily, and this is not due to any singular contamination events, but due to the PFO created by normal human activity in the laboratory.
Other types of trend can include discontinuities in the particle distribution and PAC, which correlate to specific contaminating activity. The PFO monitor can identify to the minute-level what and who was involved in the “event”.
We have therefore developed a new method of particle monitoring based on the shadows of particles being detected on CMOS image sensors, and the technique can be applied in real time with sampling frequencies possible in the range from seconds to hours.
Data can be stored and later re-analysed, enabling cleanroom operatives to identify either procedures and even specific operators or specific operations that generate excessive PFO, which could lead toward helping to reduce future incidences of the contamination.
We believe that the PFO 1000 will be a great asset to the monitoring of laboratories and cleanrooms, particularly where high-value sensitive processes are being conducted and will lead to improvements in quality standards in the trade.