When it comes to manufacturing sterile pharmaceuticals, one of the most common discussion points is around increased productivity without incurring higher costs or hefty investment.
There are many ways that opportunities for streamlining ways of working can be identified, including Lean/ Six Sigma, but these processes are often limited by perceived ‘unalterable’ parameters of the equipment needed.
For example, isolators are needed to protect the product from contamination during testing, however the isolator environment and testing consumables need to be decontaminated with vapour phase hydrogen peroxide (VPHP) before the testing can be completed [1].
This decontamination cycle takes 8 hours to complete, and, as such, productivity is limited to one test per isolator a day [2]. So how do you combat this? Invest in expensive equipment upgrades? Invest time developing and validating a new decontamination cycle using Biological Indicators (BIs)?
Or, can a decontamination cycle be optimised in an alternative and more efficient manner?
The process of validating a new decontamination cycle using BI data alone is limited
At AstraZeneca, we have demonstrated that this is possible, via the use of quantitative data generated by Enzyme Indicator (EI) technology.
In 10 days, we validated an optimised VPHP cycle for our sterility test isolators, increasing our isolator productivity by over 75% [1, 2].
How do you assess a decontamination cycle?
To optimise an existing decontamination cycle you must first assess how effective the cycle is in reducing contamination.
Assessment of VPHP decontamination has traditionally been completed using BIs [2].
BIs contain a known population, typically in the region of 106, of microbial spores which have demonstrated higher resistance to VPHP, such as Geobacillus stearothermophilus spores.
The high population and resistance of the spores ensures that the ‘contamination’ challenge on the BI is greater than any microbial challenge expected in the isolator environment [1].
These BIs are then placed in the isolator and a VPHP decontamination cycle is completed. Once complete, the BIs are collected from the isolator, immersed in microbial growth media and incubated for 7 days.
If, after 7 days, there are no signs of microbial growth, the BIs are considered to have been effectively decontaminated by the VPHP, proving that the decontamination cycle is effective [2].
Assessment of VPHP decontamination has traditionally been completed using BIs
However, as is the nature when using microbiological tools, the population on the spore strip and the resistance of the spore population is inherently variable and, as such, the BIs are unable to provide a consistent level of challenge [2].
A sample of the BIs are routinely tested for population upon receipt of each batch to try to minimise the impact of this, but receipt testing allows for 50-300% variation of the original population stated by the manufacturer [2].
Furthermore, the extent of insight that can be gained from BI data alone is restricted due to the qualitative ‘alive or dead’/’growth or no-growth’ results.
For example, a ‘no-growth’ result only tells you that the BI spore population has been sufficiently ‘killed’, but not when the point of ‘kill’ occurred in the cycle.
Therefore, the process of validating a new decontamination cycle using BI data alone is limited, requires significant time investment, and can lead to unexpected BI growth during the qualification stages.
This can elongate the development and validation process by weeks at a time, and so to compensate, the decontamination cycle is lengthened, or more H2O2 is used, in order to provide an ‘over kill’, resulting in an inefficient cycle that takes longer than is necessary to complete [2].
The enzyme indicator (EI)
EIs are strips of thermostable adenylate kinase (tAK) which quantitatively assess decontamination efficacy of VPHP cycles.
The EIs have been proven to provide sufficient resistance to VPHP, and, with <15 CV% variation across the batch, pose a more controlled and consistent challenge than the BI.
The tAK enzyme catalyses the production of bioluminescence, and so decontamination cycle efficacy can be accurately assessed by measuring the amount of bioluminescence produced after the EI has been exposed to the VPHP cycle [2].
Like the BI, EIs are placed within the isolator in the same predetermined locations and exposed to a decontamination cycle.
Can a decontamination cycle be optimised in an alternative and more efficient manner?
However, unlike the BI, each EI sample takes only 60 seconds to assay, with the quantity of produced light measured and reported in relative light units (RLU) upon assay completion.
This enables deeper insight into the decontamination cycle efficacy as the results can be graphically trended with efficacy in each sample location compared across the isolator, and overall results compared across each completed cycle [2].
Furthermore, the relative light unit (RLU) results directly correlate with BI spore log reduction, enabling the EIs to report log reduction and thus the amount of overkill on a cycle can be quantitatively assessed [2].
How do you identify if an existing decontamination cycle can be optimised?
To optimise the decontamination cycle, AstraZeneca first ascertained the point of BI kill of the existing VPHP cycle.
To do this, a ‘fractional study’, also known as a ‘time point removal study’, was performed using the ‘quench method’.
To perform a fractional study, multiple BIs and EIs are exposed in one location, then, at certain time intervals during the gassing cycle, one BI and one EI are collected and immersed in their reflective test medias in order to ‘quench’ the VPHP and stop the decontamination at that time point.
This procedure maps the exact time point at which a log6 BI spore reduction is achieved, generating a corresponding EI RLU value.
Results from the fractional study demonstrated that a log6 reduction/BI kill was being achieved at the start of the cycle during the ‘gassing’ phase (also known as conditioning phase), where high volumes of VPHP are pumped into the isolator in order to rapidly raise the VPHP concentration [1,2].
Upon completion of the optimised cycle, the EI results confirmed that there had been no significant change in the decontamination efficacy
This is not ideal as this often results in inconsistent decontamination efficacy. Robust decontamination cycles are designed to have the BI kill point during the ‘gassing dwell’ phase (or decontamination phase), which ensures more consistency in results as the BI kill is occurring after the VPHP concentration has stabilised [2].
Following this, the gassing cycle was cut from a 25 minute ‘gassing dwell’ period, to 10 minutes, and a distribution study performed.
To perform a distribution study, EIs and BIs are secured into defined locations across the isolator and tested upon completion of the VPHP cycle.
The EI data from each cycle was then compared and contrasted, with results demonstrating that the reduced cycle was providing similar decontamination efficacy to the original cycle.
These results, when considered alongside the fractional study, also demonstrated that much more VPHP was being used in each cycle than was needed, and as such there was significant opportunity for the cycle to be optimised [2].
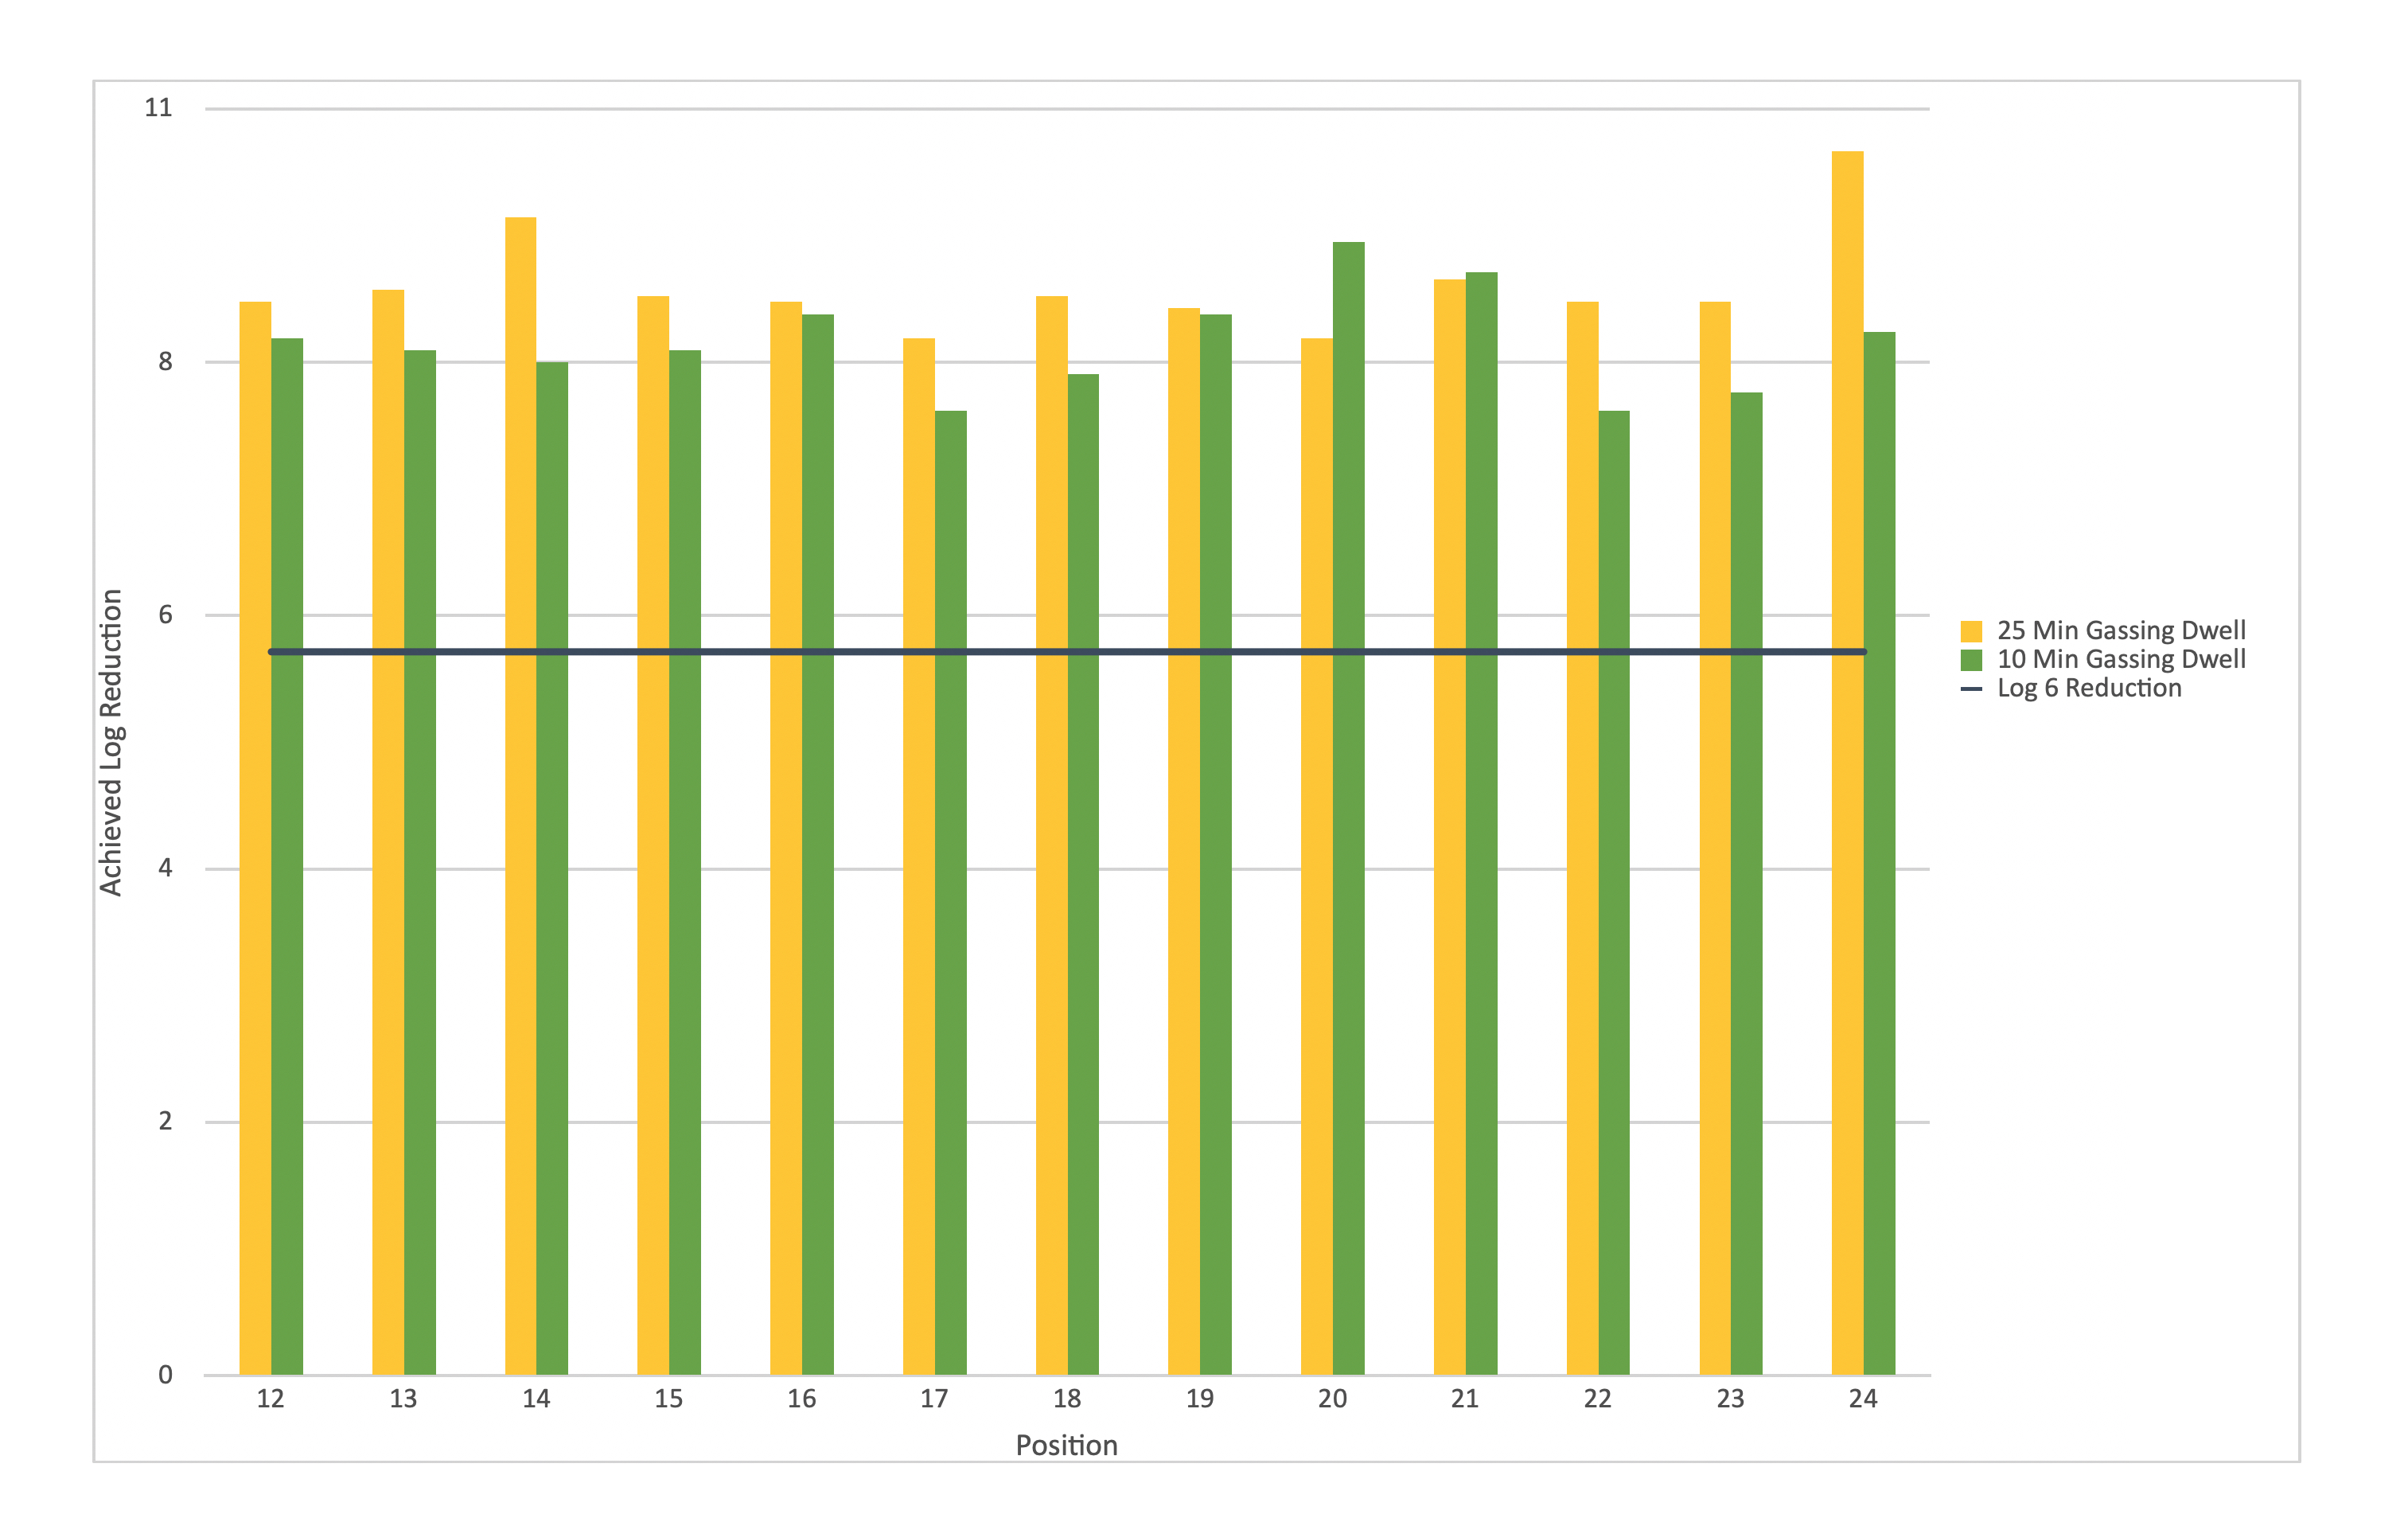
Figure 1: EI results from 10-minute gassing dwell show little change from the results achieved after 25-minute dwell
Utilising the results achieved in these two cycles, a proposed optimised cycle was trialled.
This cycle reduced the VPHP injection by 58%, subsequently providing a 44% reduction in total cycle time[2].
This reduction in cycle time enabled a 78% increase in isolator productivity, which, in turn, increased the overall equipment efficiency (OEE) by over 80%.
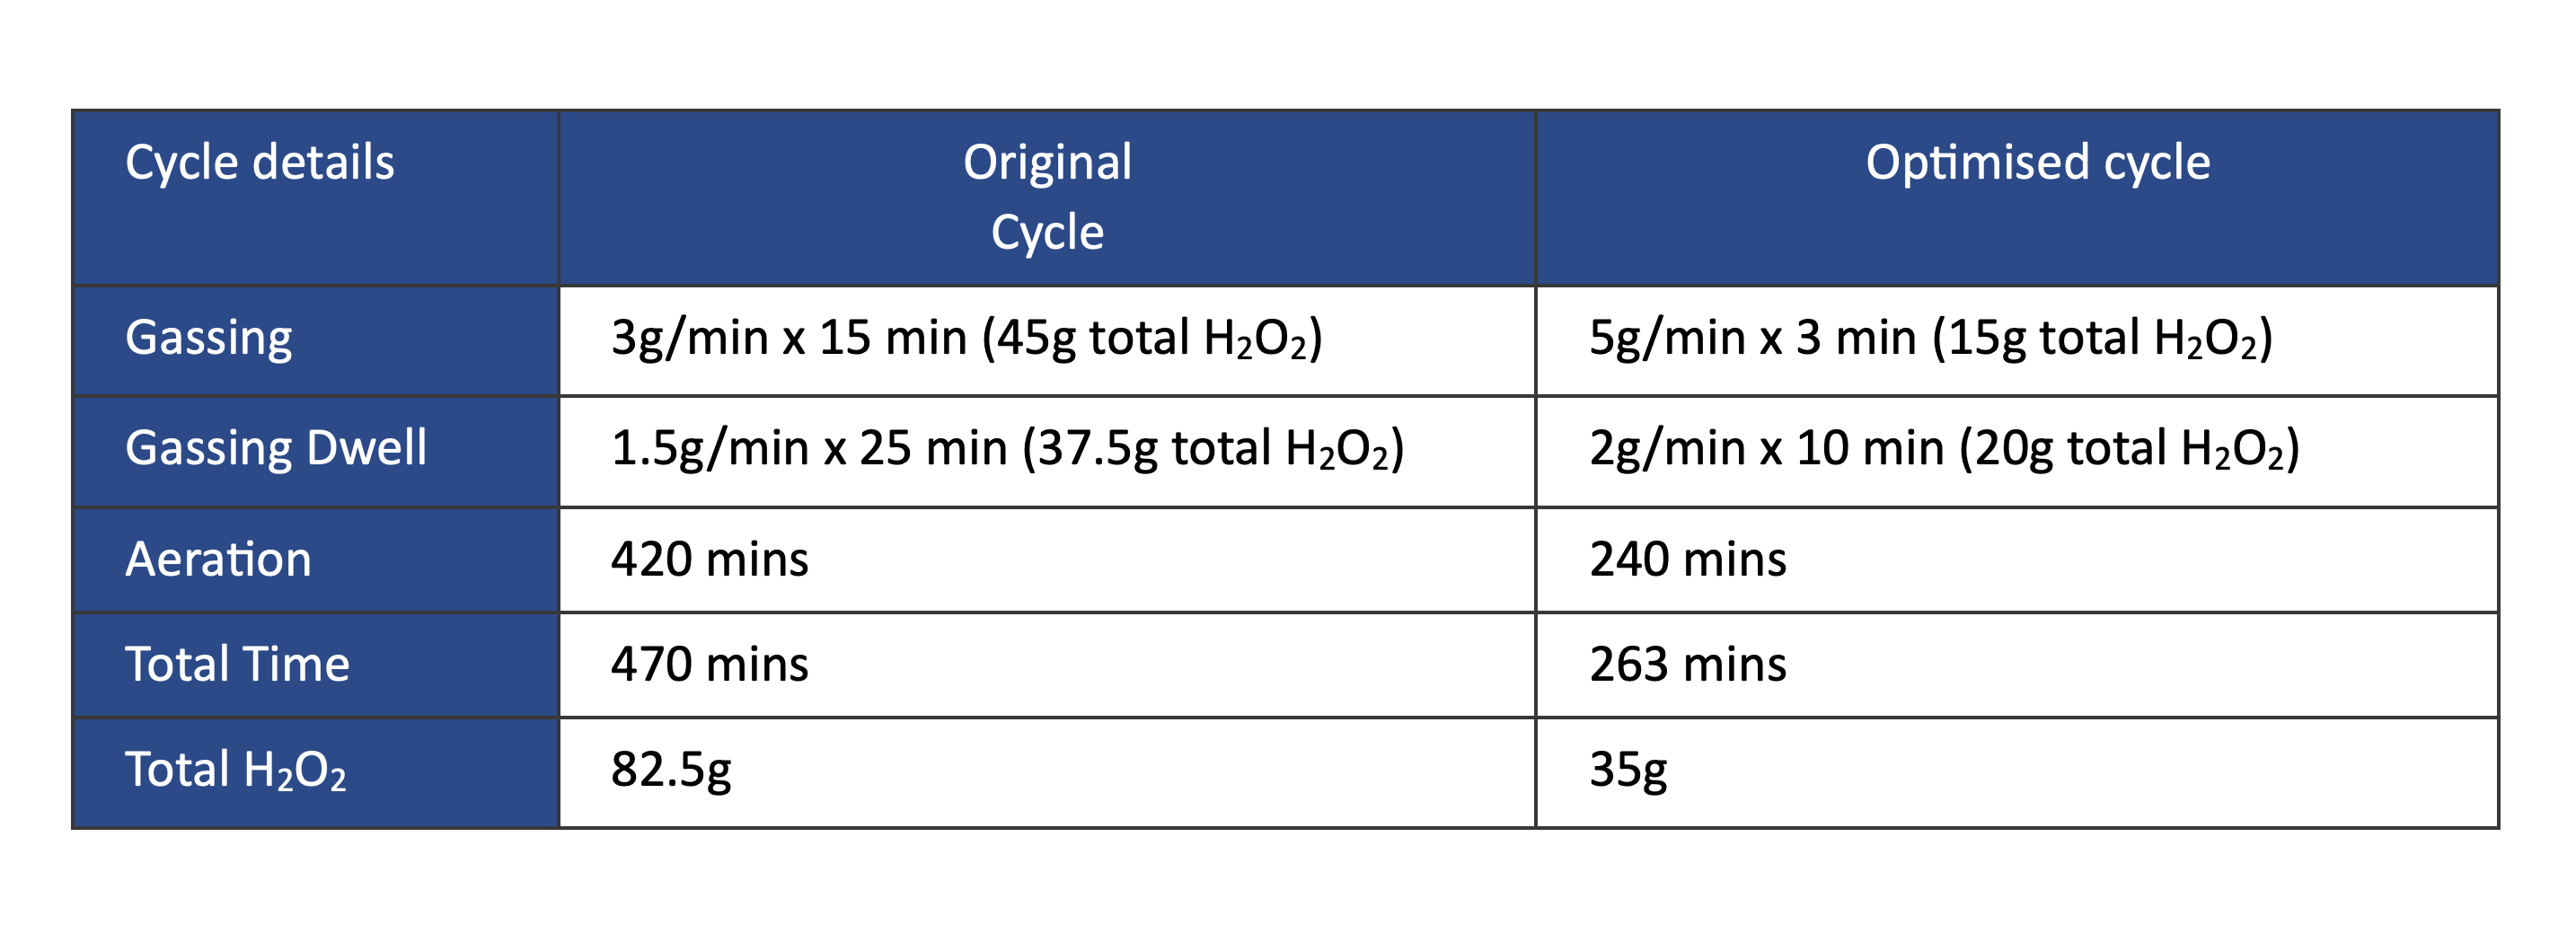
Optimised cycle parameters halved the total gassing cycle time
Upon completion of the optimised cycle, the EI results confirmed that there had been no significant change in the decontamination efficacy [2].
This provided sufficient evidence to enable the optimised cycle parameters to be submitted to formal cycle validation.
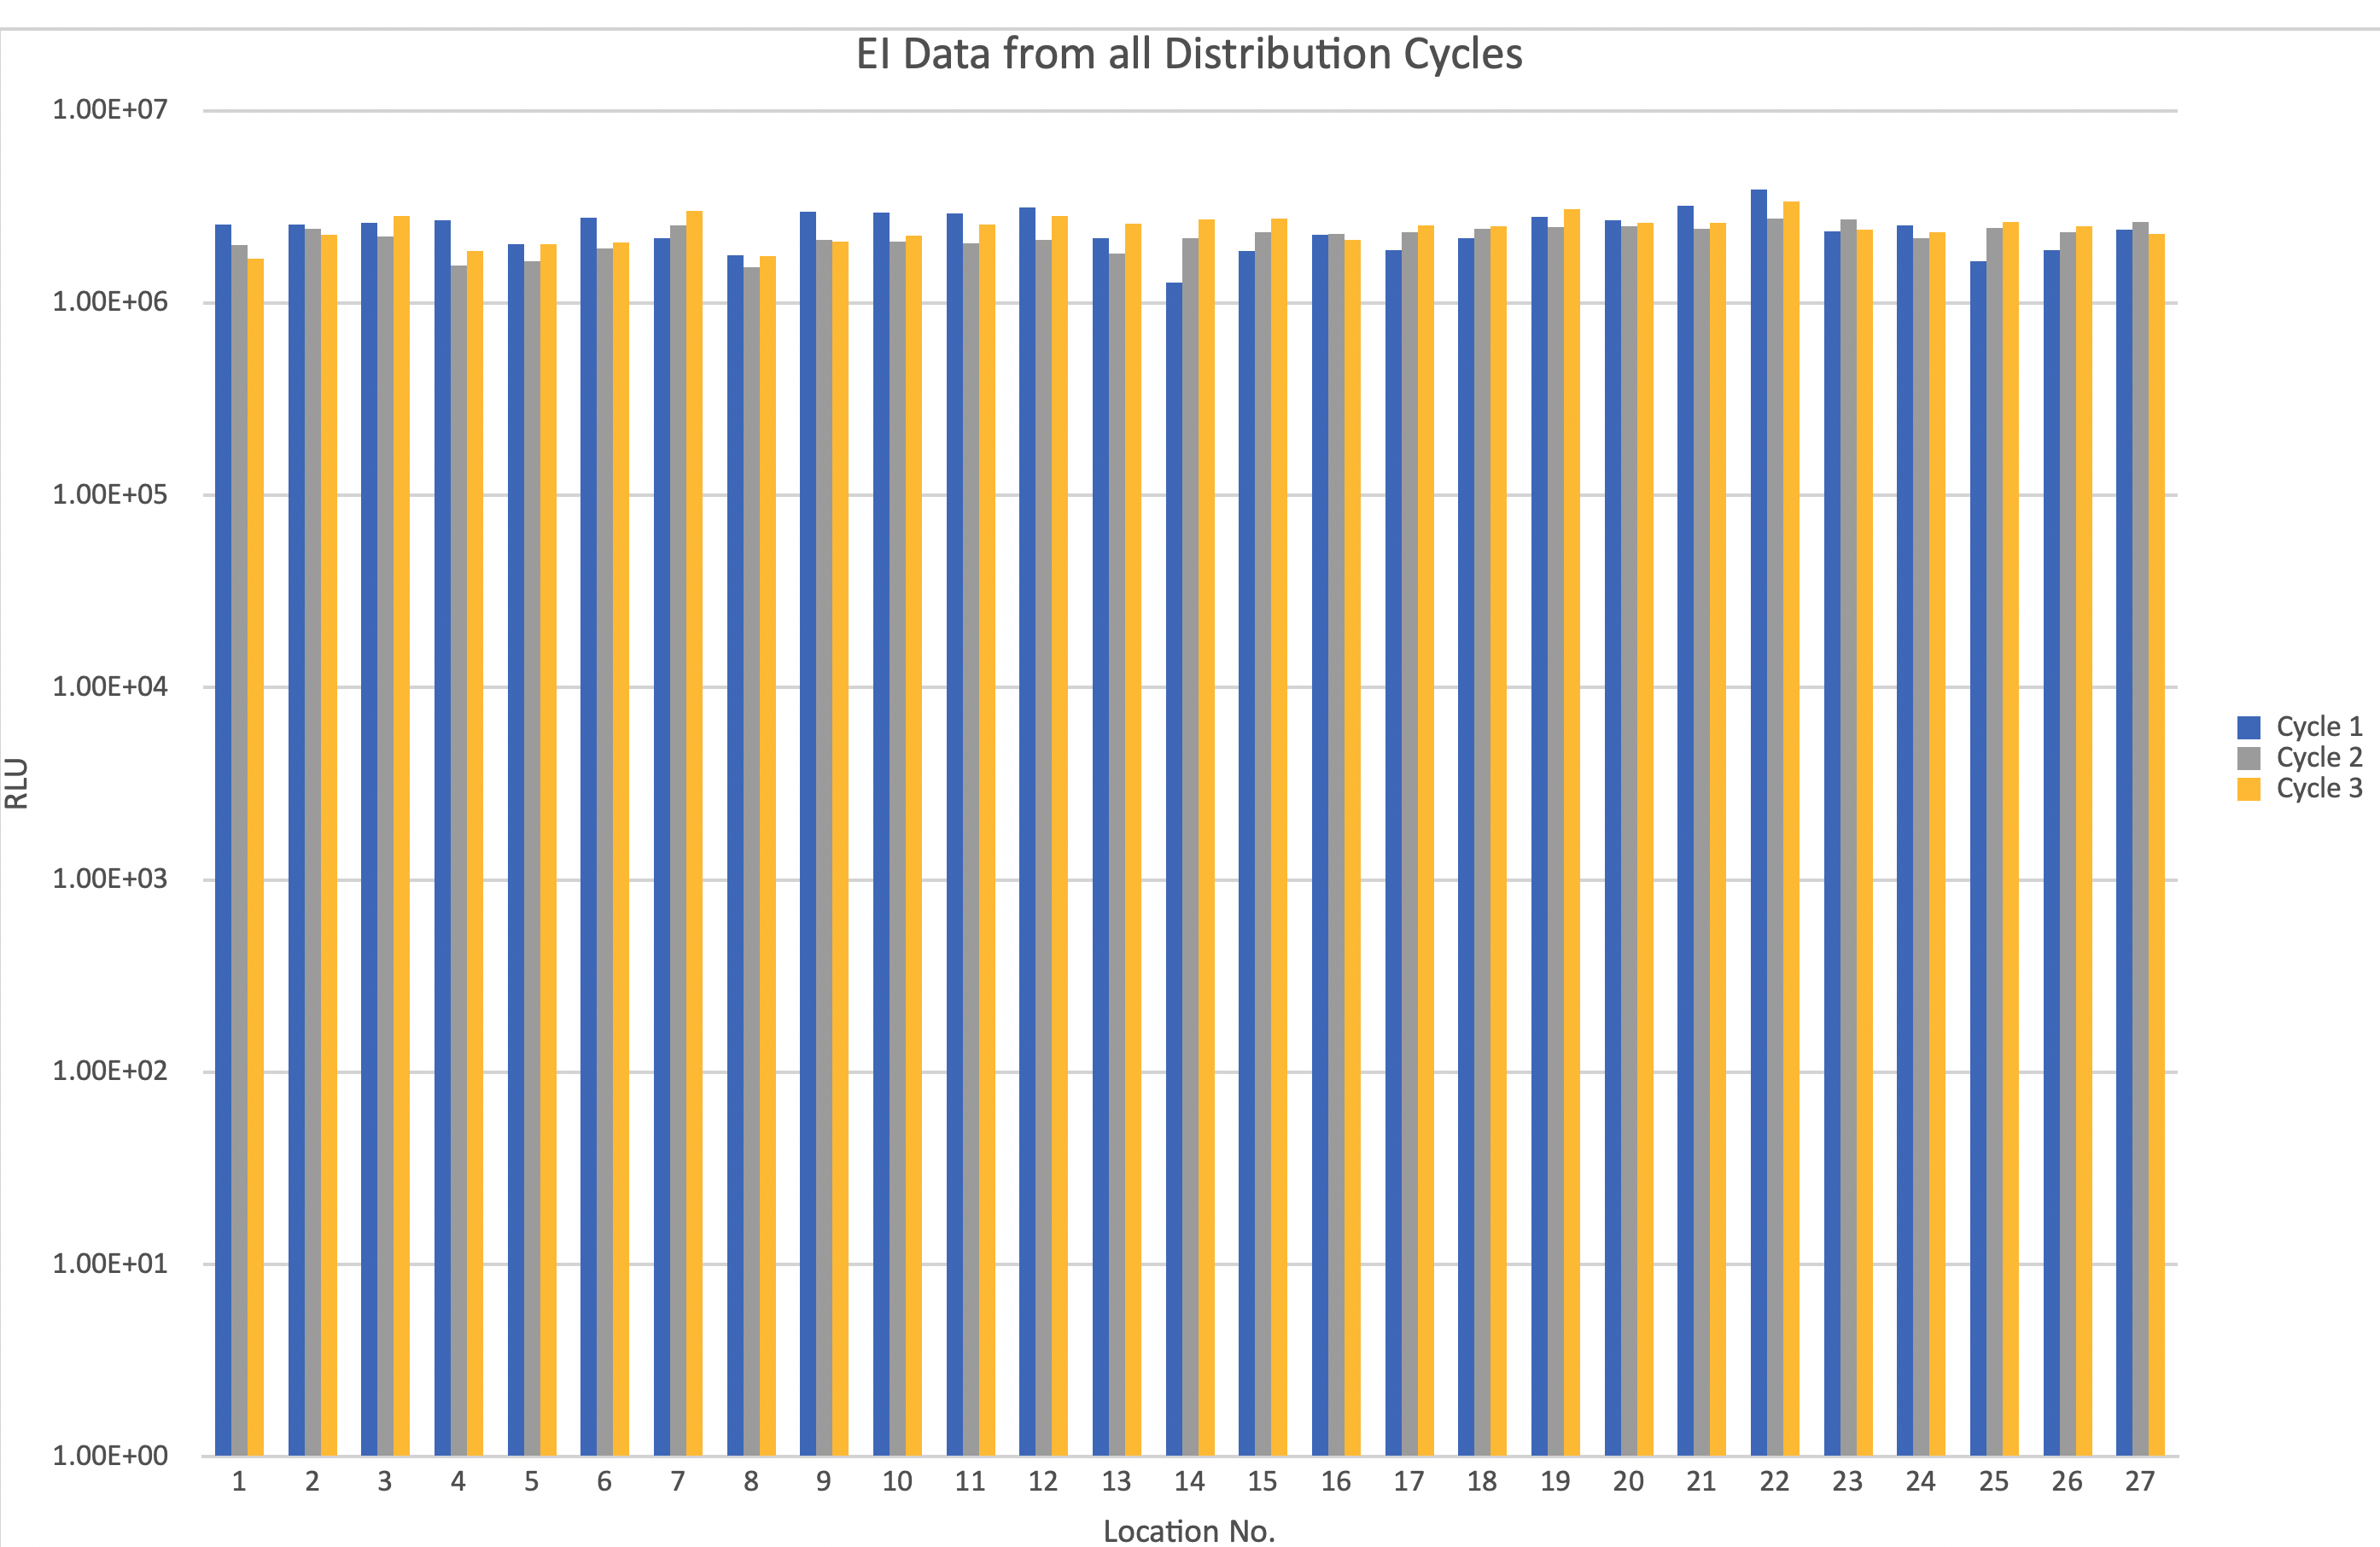
EI data demonstrates that the optimised cycle provides consistent decontamination efficacy
Utilising the EI data, AstraZeneca streamlined the validation as confidence could be gained that the cycle had passed and so the validation could progress without waiting 7 days for the BI results between each cycle.
Upon completion of all testing, the data gathered from the EI and BI results showed that the optimised cycle parameters provided repeatable, and consistent decontamination efficacy and thus the cycle was regarded as validated [2].
The optimised cycle was then implemented into routine use upon validation completion.
Conclusion
AstraZeneca have demonstrated how, by using quantitative data generated by the EI technology, existing isolator decontamination cycles can be efficiently optimised to increase their productivity, in a timely manner.
With the added insight and confidence gained from the quantitative EI data, over-extended ‘over kill’ cycles can be quickly characterised and rationalised so as to radically reduce the cycle time without compromising the efficacy of the decontamination cycle [2].
This has enabled the cycle parameters to be significantly improved, which reduces the cost of the cycle, provides over 75% increase in the productivity potential of the isolator and provides over 80% increase in OEE.
Therefore, when it comes to cycle optimisation and validation, use of EIs has proven to be a powerful tool [2].
References
- Stephen Dawson, Callum Dew, Miriam Guest. Enzyme Indicators to Support Decontamination Cycle Optimisation. Pharmig News, April 2023, Issue 91 pg. 3-4
- C. Dew. Use of EIs in Vapour Phase Hydrogen Peroxide Decontamination Cycle Optimisation and Rapid Validation. ScienceVolks SVOA Microbiology ISSN: 2634-534X, 08 Nov 2023
Top image: Rigid-walled sterility test isolator with half-suit