EU GMP Annex 1 specifies limits of air-borne particles concentration for particle sizes > 0.5 µm and > 5.0 µm. The US FDA requests control of those for 0.5 µm only. There is no evidence that American drugs are worse. Is control of particles > 5.0 µm reasonable or it is a dogma not confirmed by modern knowledge? Is it worthwhile to control particles > 5.0 µm in addition to > 0.5 µm? This article will discuss the consequences of incorrect interpretation of ISO 14644-1 and explain its origin.
Changes to Annex 1
The FDA norms on air cleanliness for aseptic processes have been stable since the 1980s but the EU GMP Annex 1 has been changed several times (Table 1). Limits for particles > 5.0 µm concentrations are subject to change as shown in marked cells in Table 1 (Grades A/B). Initial limits were zero until 2003 because no microorganisms were permitted in these zones. Then some experts said that 0 is statistically nonsensical and a single count can be a result of electronic noise, meaning changes were made in 2003.
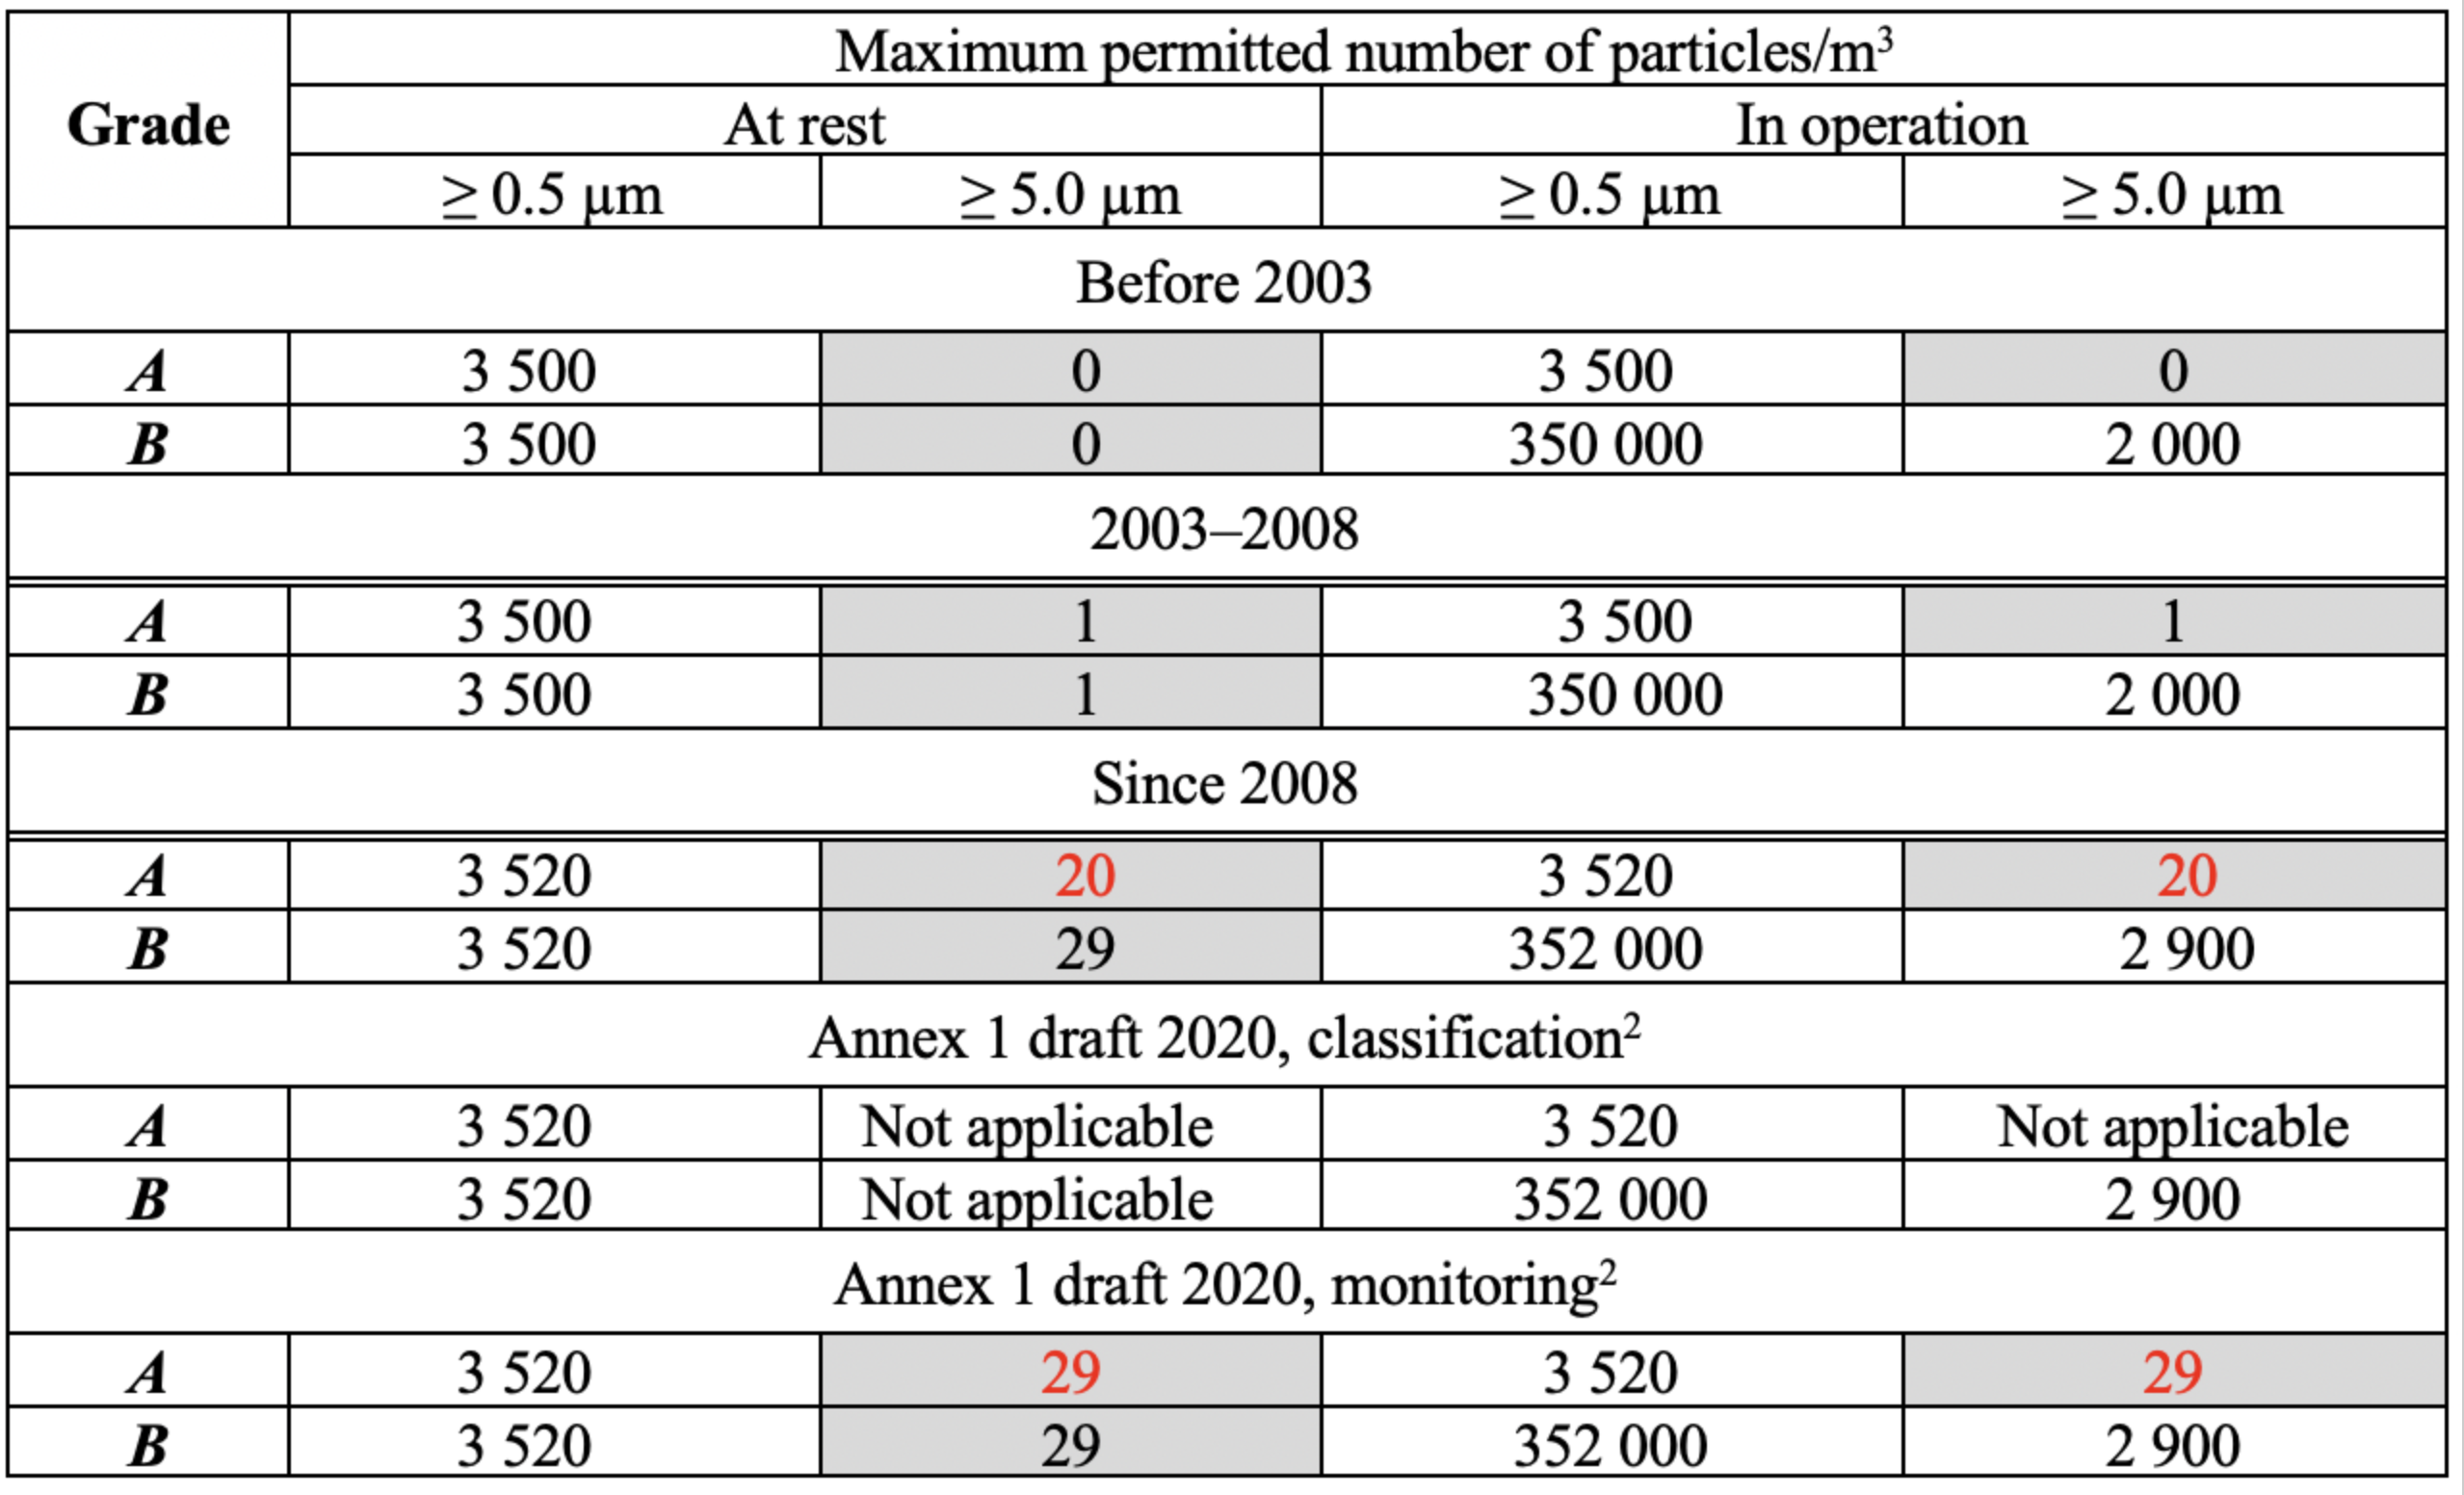
Table 1: Changes of Annex 1 limits for airborne particles concentration, Grades A/B. * The form of classification Table in Annex 1 draft 2020 differs from 2008 edition for unknown reasons; this article uses the 2008 form
In 2008, limits for particles > 5.0 µm became 20 instead of 1 for Grade A both at rest and in operation. The consequences were confusing:
a) Particles> 5.0 µm limits became two classes weaker. What about the care for quality that is declared as a paramount GMP purpose? The old 0 or 1 limits were achieved in good cleanrooms long ago and there was seemingly no reason for making norms worse:
b) ISO Class 4.8 appeared in 2008. It is not possible to distinguish between ISO 4.8 and ISO 5 classes because of particle counters precision (normally ± 20%) and real fluctuations of particles concentration.
Following this, the Annex 1 draft became even worse increasing the limit for particles > 5.0 µm up to 29!
Harmonisation with ISO 14644-1 standard
It seems that the reason for the Annex 1 change in 2008 and for the 2020 draft was harmonisation with the ISO 14644-1:1999 standard (revised in 2015). Converting particles concentrations for 2003-2008 period of time from Table 1 into ISO Classes gives an interesting picture (Table 2).
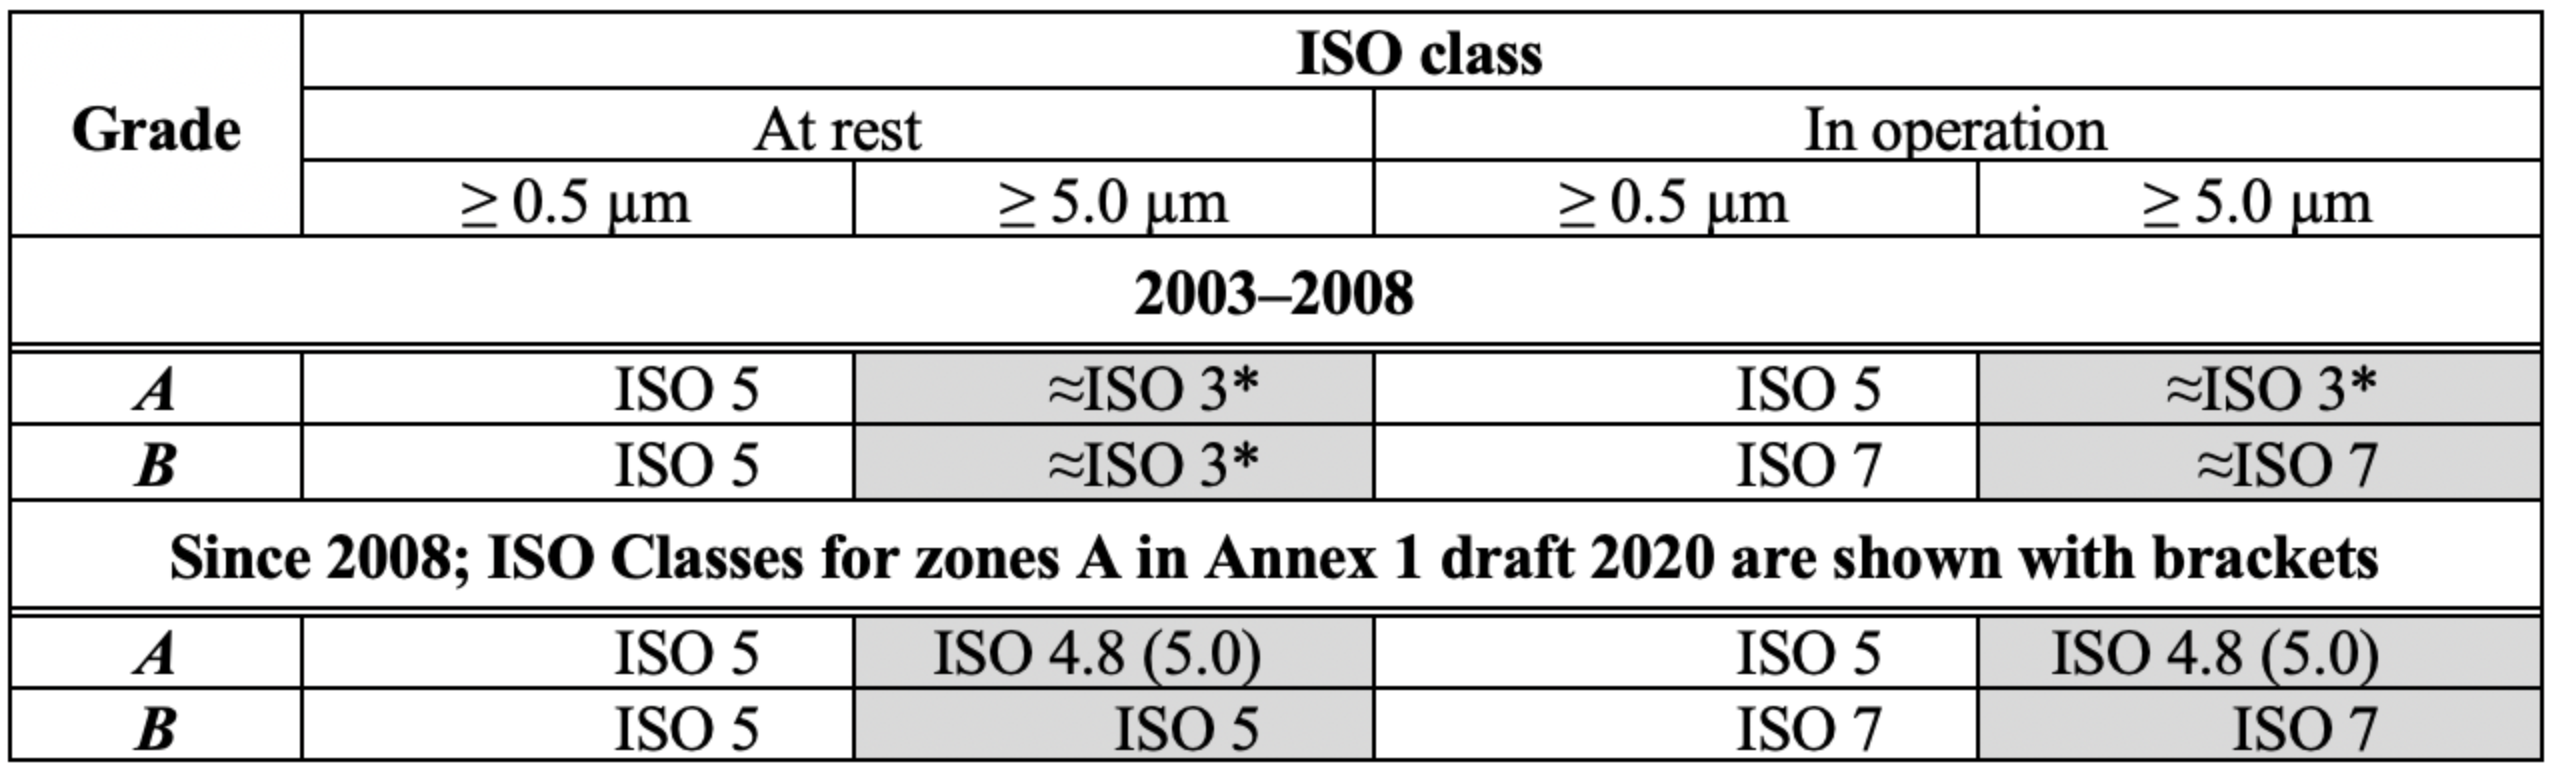
Table 2: Annex 1 limits for particles concentration for Grades A/B presented as ISO classes. * Extrapolation of limits in ISO 14664-1 approximately
ISO classes for particles > 0.5 µm and > 5.0 µm for the same occupancy state (at rest or in operation) were dramatically different before 2008. There was an ISO Class 5 for Grades A/B for particles > 0.5 µm and ISO Class 3 (if to make some extrapolation) for particles > 5.0 µm.
This did not seem to work well and so the idea of harmonisation appeared. ISO Class 5 was assigned to Grade B at rest with a limit 29 particles > 5.0 µm/m3 according to ISO 14644-1:1999. The limit of 20 particles > 5.0 µm/m3 for Grade A was taken arbitrarily by experts as it "should be tighter than for Grade B". So ISO Class 4.8 appeared.
But the underlying problem was, nobody asked simple questions:
- Does the ISO 14644-1 table reflect reality someway or this is an abstract presentation only?
- Can it be used to set limits for different particle sizes for the same facility?
The ratio between particle concentrations for Grade B "at rest" in Annex 1 is:
Cn>0.5 µm/Cn>5.0 µm = 3500/29 ≈ 121
Testing of cleanrooms by the authors gave experimental data for this ratio that is approximately between 5:1 and 1000:1 for both "at rest" and "in operation" occupancy states. The ratio Cn>0.5 µm/Cn>5.0 µm was ≈ 5-10 for zones B in most cases.
Similar results were presented by a well-known British GMP expert John Sharp. Of course, there was never an intention to set correlation between particle concentrations for different particle sizes. But the ISO table looks impressive and nobody soundly explained its origin and that created misunderstanding.
Origin of ISO 14644-1 classification table
So how did the ISO classification table appear? The famous US Federal standard 209 gave a classification of cleanrooms in the early 1960s. Class number meant the maximum allowable concentration of particles with sizes > 0.5 µm per 1 cubic foot of air (classes 1; 10;...100 000). It was simple and probably the best cleanroom classification system that has ever existed. It was based on a log-linear principle that can be presented as a line on a graph for a threshold 0.5 µm. ISO 14664-1 is based on the Japanese standard JIS B 9920:1989 and uses the same log-linear approximation presented by formula (1). This formula is artificial. It can be traced to Fed. Std. 209 for particles > 0.5 µm converting cubic feet into cubic metres and using a sequence of numbers 1; 10.... So a log-linear model for a single particle size > 0.5 µm was spread to different particles sizes. The maximum permitted concentration of particles Cn for each considered particles size, D is determined from the equation:
Cn = 10
where
N.... is the ISO class number,
D...is the considered particle size, in µm.
0.1...is a constant, with a dimension of µm.
This formula never represented particles concentrations in actual conditions.
The ISO 14644-1 classification table is good to use for one particle size (threshold) only for a given application. At last, it is not so important how numbers appeared.
A common agreement is the main point. But the picture is being changed to specify limits for different particle sizes in the same cleanroom. Different cleanliness classes can be the result and these differences can be of the orders of magnitude scale. This is an absolute non-sense.
It is certainly possible to specify a non-sense. But how do you realise this non-sense practically? How do you design and build a cleanroom with, say a ISO Class 6 for particles > 0.5 µmm and ISO Class 3 for particles > 0.2 µm? Nobody knows. If you try to specify two different classes for the same cleanroom, then there can be a big gap in one case and very tight conditions in another.
How would you explain criteria for cleanliness classes for different particle sizes? No answer again.
Annex 1 draft 2020, item 4.29, recommends measuring particles > 1.0 µm without setting limits and explaining what it is for. Confusion is triumphing.
MPPS point
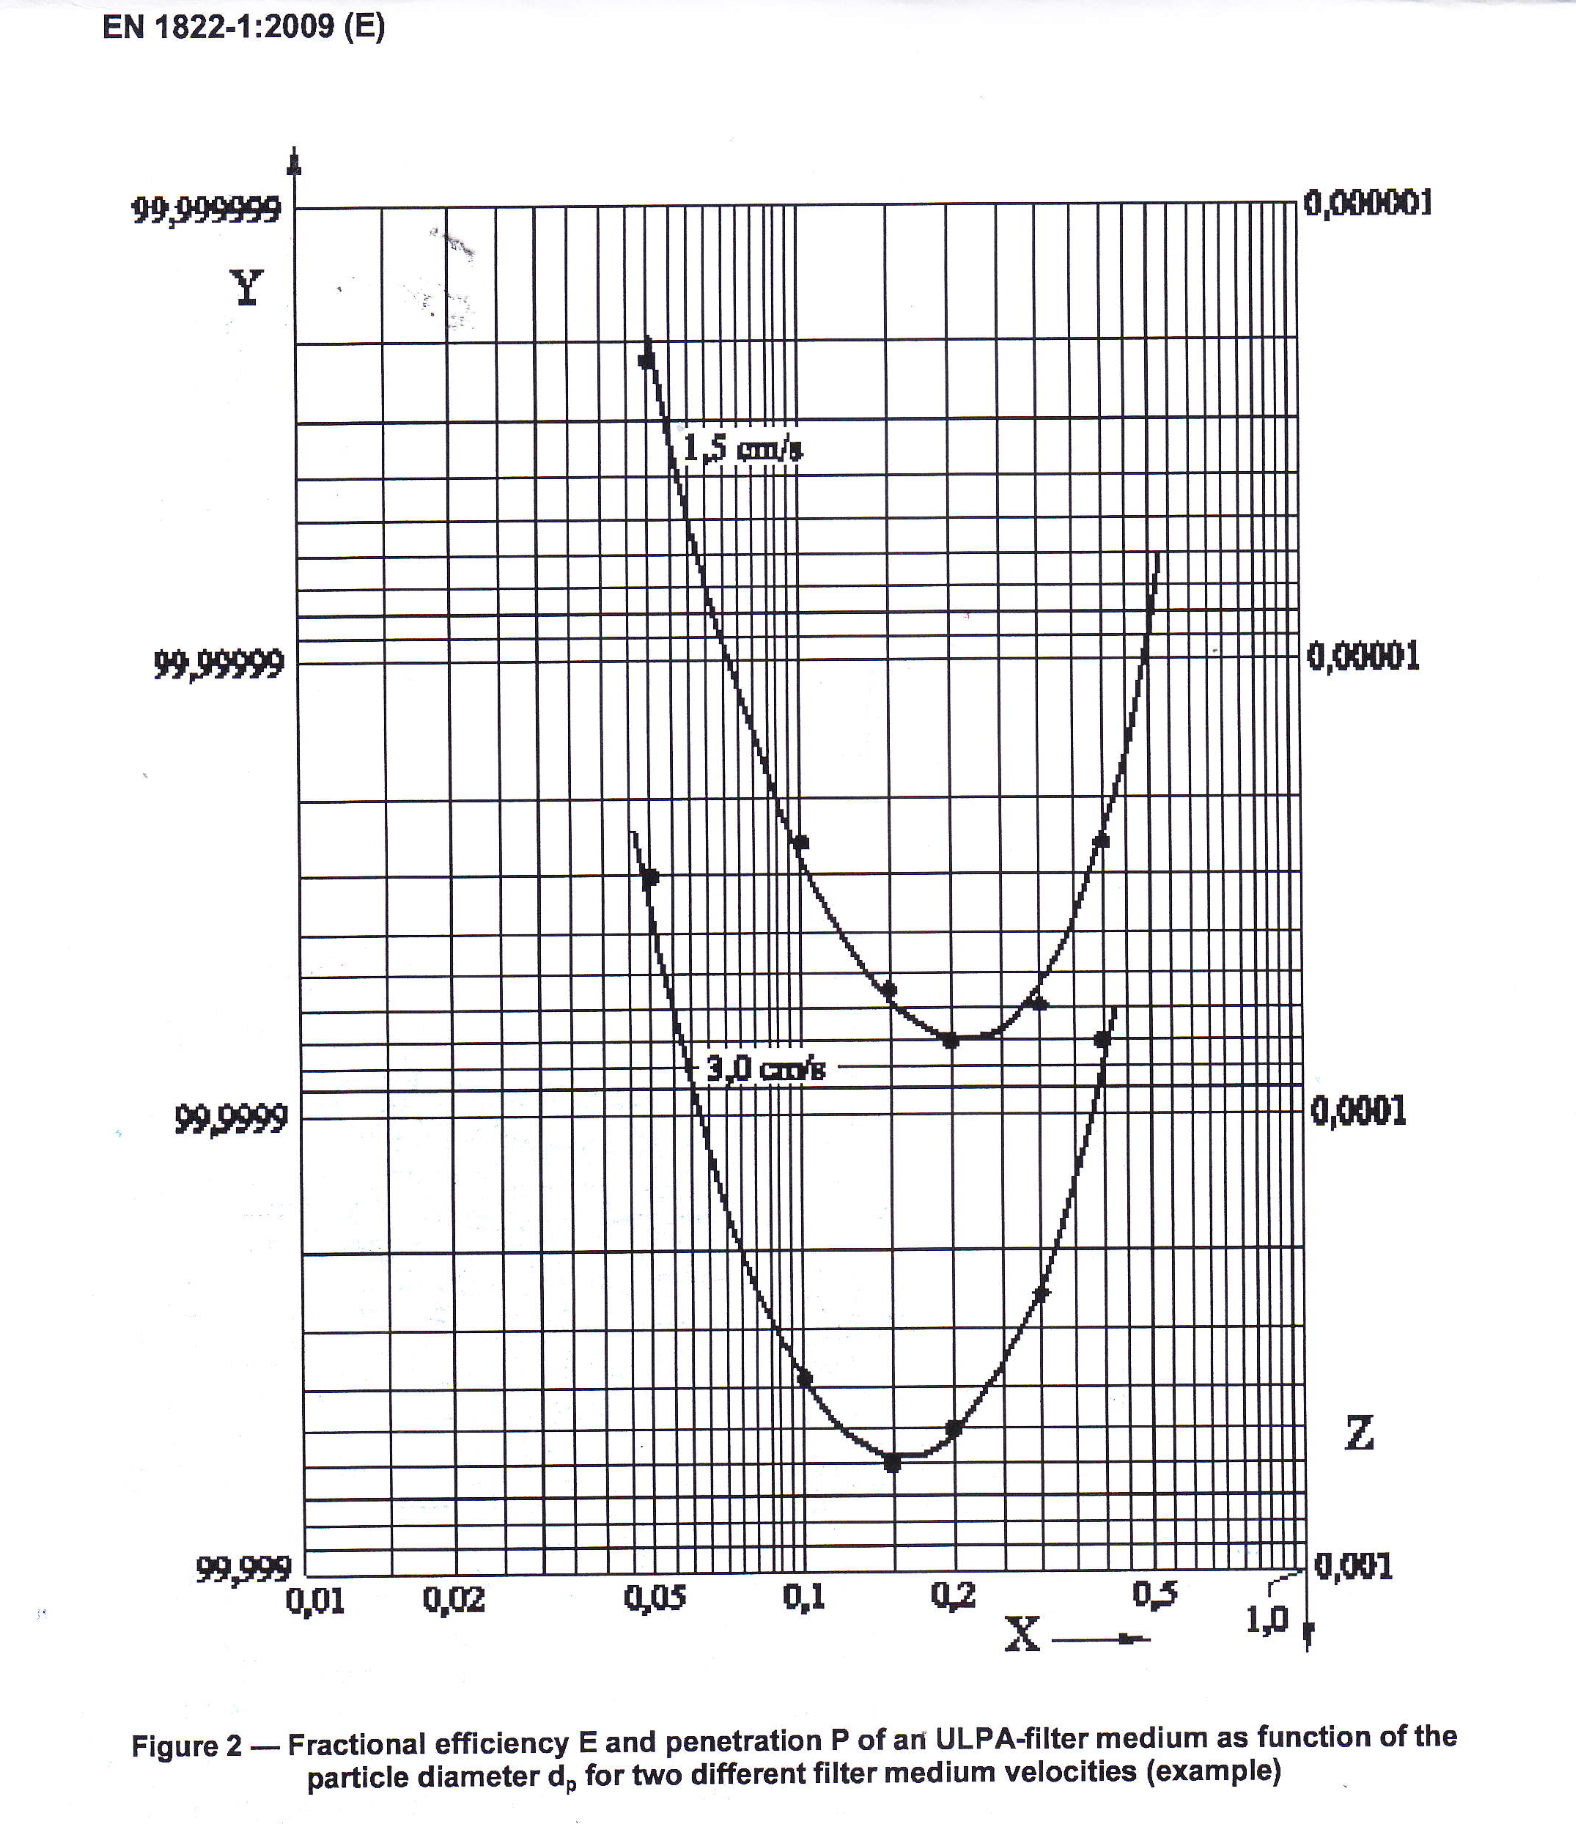
Figure 1: Fractional efficiency E and penetration P of an ULPA filter medium as function on the particle diameter dp for two different filter medium velocities (example)
Setting particles concentration limits for different particle sizes depends also on air filters efficiency. This efficiency depends dramatically on particle size. A filter efficiency curve has a minimum known as a Most Penetrating Particle Size (MPPS).
This feature is based on basic filtration effects and is a law of nature.
Normally MPPS point for HEPA/ULPA filters is between 0.2 and 0.5 µm, Fig.1 (Fig.2 from EN 1822-1:2009). For bigger particles filtration efficiency grows rapidly. For >5.0 µm particles it exceeds many orders of magnitude.
So testing of particles at 0.5 µm gives assurance that limits for > 5.0 µm particles that can carry microorganisms will be satisfied with great redundancy.
Testing vs monitoring
The Annex 1 draft sets tighter requirements for routing monitoring than for start-up testing. This is violence against common sense and established practice. Initial testing shall be always more detailed than monitoring.
Conclusions
1. Control of particles with sizes > 0.5 µm only is enough for GMP purposes.
2. Generally there is no sense in specifying cleanliness classes for different particle sizes for the same facility. One size is enough.
3. There has been a push in order to make GMPs more complicated without any logic to it.
Though harmonisation is a reason that might hold some sway, there has been a lot of nonsensical changes, somebody has to stop it.