
Although demand has grown for low-energy cleanrooms, many users and designers still calculate the required air supply flow rates for non-unidirectional airflow (non-UDAF) based on the approach developed during the 1950’s which had an average room air change rate of 20 per hour.
The US FDA Aseptic Processing Guide 2004 1 includes this value of ‘at least’ 20 air changes per hour (ac/hr) for Class 100,000 (ISO Class 8, EU Grade C in-operation) supporting rooms with ‘significantly higher air change rates’ for rooms requiring better levels of cleanliness.
US FDA Aseptic Processing Guide 2004 1 recommendations of a minimum of 20 air changes per hour for this cleanroom
Consequently, a more scientific-based solution, which considers the correct factors that relate to the control of airborne contamination and can determine the required airflow to meet a specified cleanliness level, is desirable and reported in this paper.
Different methods: Air-change rate vs Scientific approach
Consider an EU Grade C (US Class 100 000 1, ISO 8) non-UDAF cleanroom that has a floor area of 52.3 sqm and is 3m high, and so has a volume of 157 m3. It is occupied for 8 hours per day by five operatives all gowned in EU Grade C garments with a pore size 26 µm and there are no areas of exposed skin.
The ventilation system has simple perforated plate supply terminals spread equally around the room, with H14 HEPA filters, which have been successfully integrity tested, and ceiling mounted extracts in each corner of the room. The cleanroom is controlled at a positive pressure with respect to adjacent rooms and the external environment and has no uncontrolled leak paths. There are no emissions from equipment used in the cleanroom and no emissions from the product or processes.
Air-change rate
US FDA Aseptic Processing Guide 2004 1 recommendations of a minimum of 20 air changes per hour for this cleanroom. The cleanroom air change rate is determined by dividing the rate of volume air supply by the room volume. Therefore, the air supply rate can be determined from Equation 1 (Below).
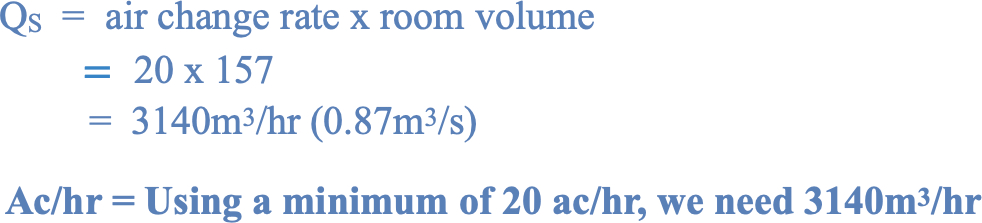
Equation 1
Scientific approach
Equations used to calculate the airborne concentration of particles and microbe-carrying particles (MCPs) in the build-up, steady-state, and decay conditions in non-UDAF cleanrooms have been previously discussed (2012). The average airborne concentration can be calculated by the Equations 2 and 3.
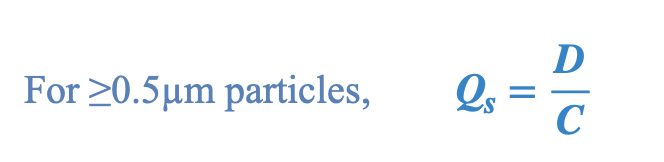
Equation 2
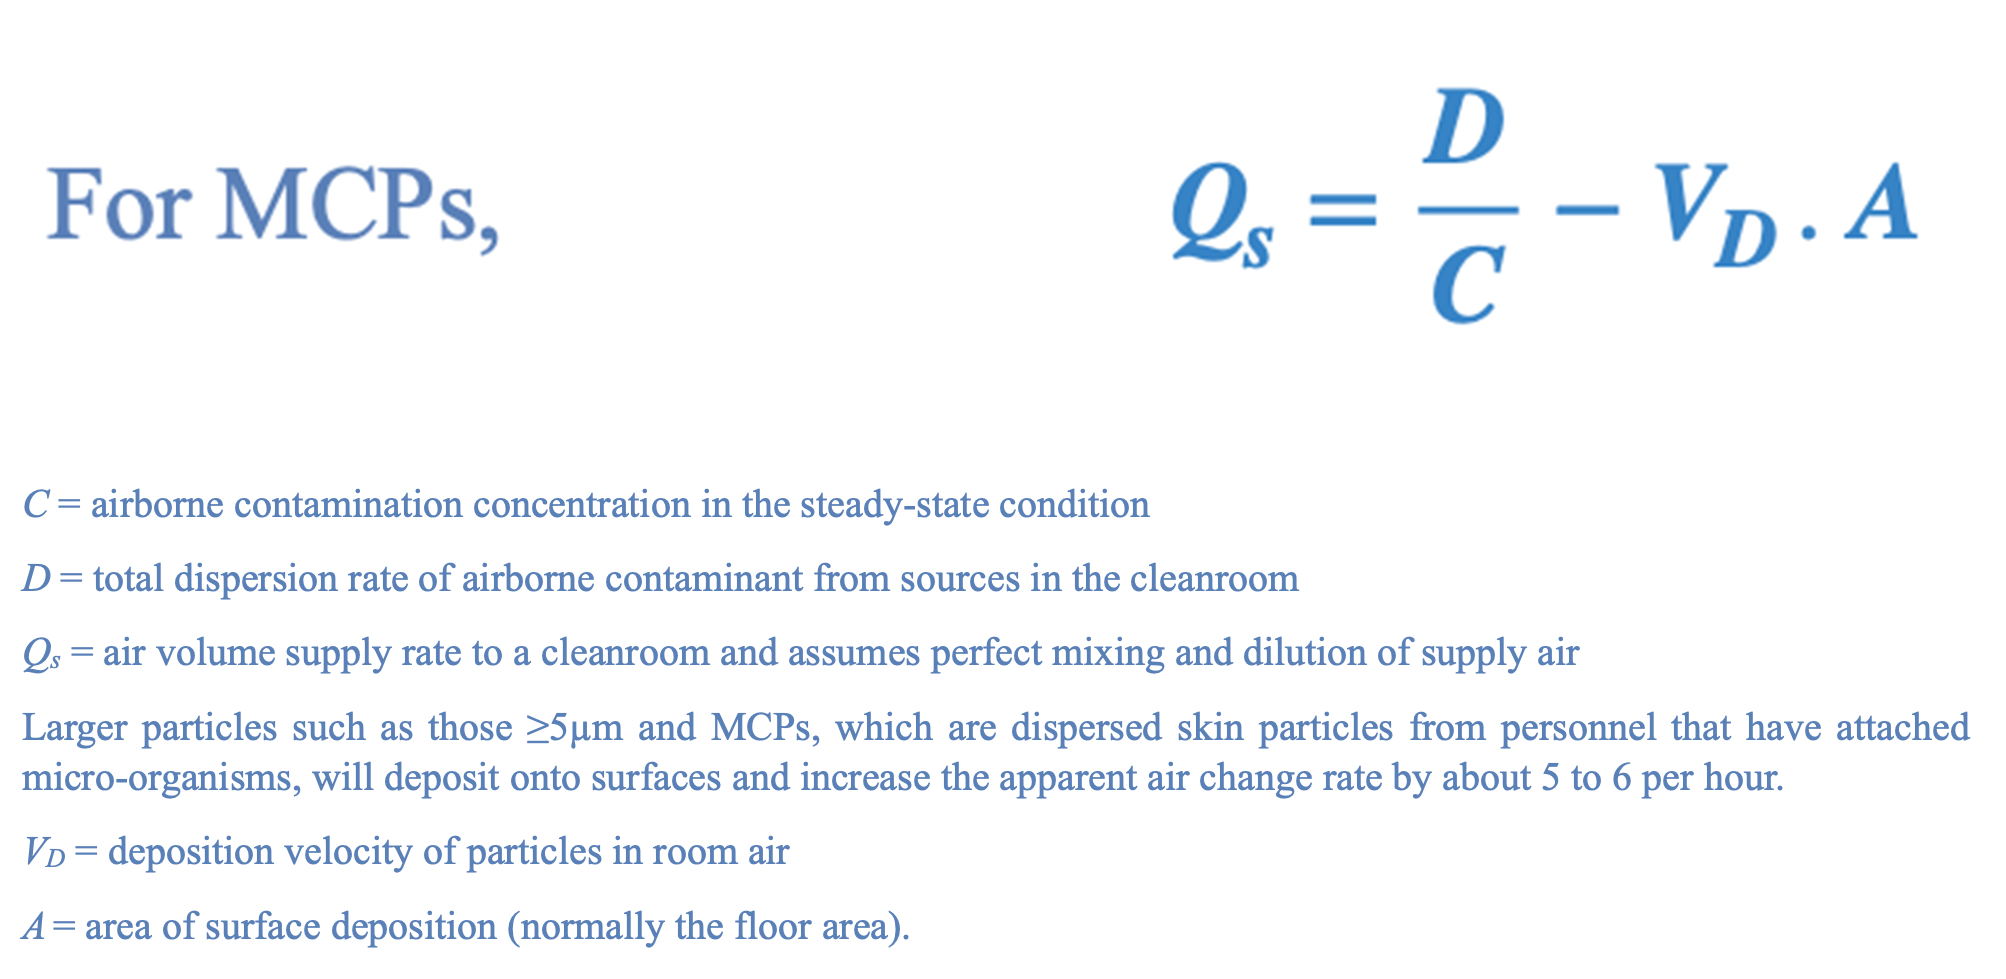
Equation 3
Studies of operational system ventilation effectiveness of the air supply in non-unidirectional airflow cleanrooms have reported imperfect mixing of the air supply and room air, and hence different concentrations of airborne contamination throughout the cleanroom. The ventilation effectiveness (VE) at a location in a cleanroom is the same as the Local Decay Rate (LDR) and also the Local Air Change (LAC) coefficient, and can be determined using Equation 4.
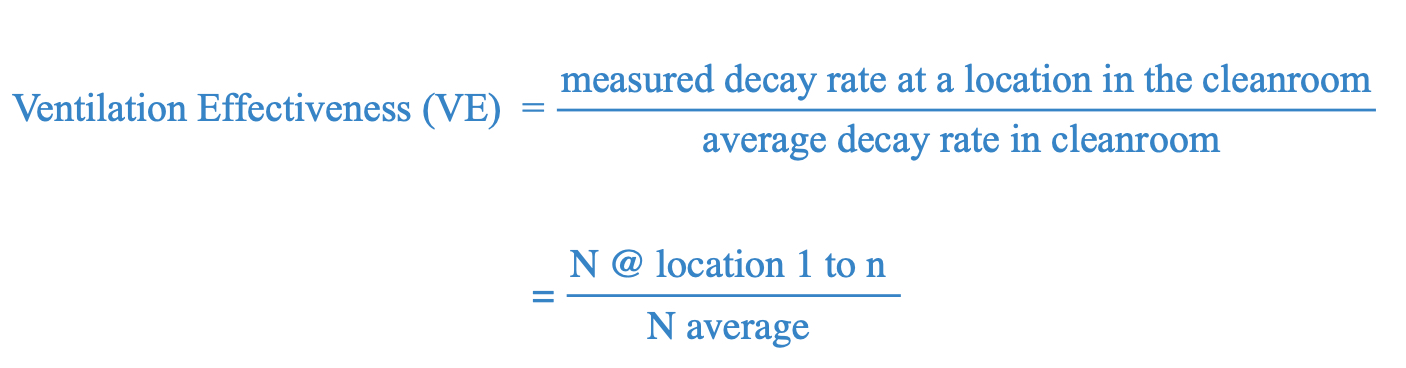
Equation 4
The decay rate at a location is obtained by measuring the decay of test particles and the use of Equation 5, and this is also known as the Recovery Rate test as described in ISO14644-3 6 and is undertaken in a number of locations around the cleanroom under consideration.
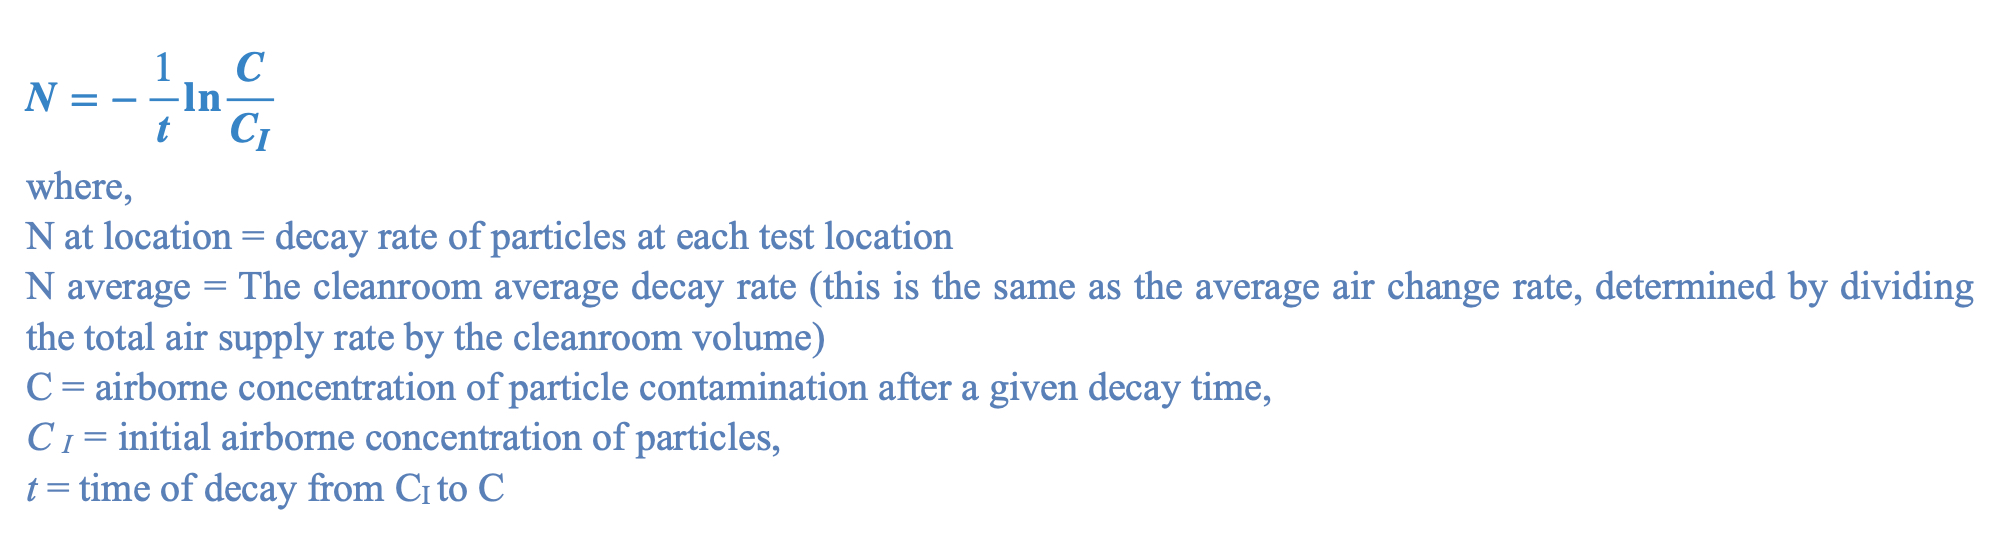
Equation 5
From completed experimental work 7, typical VE values for some locations in non-UDAF cleanrooms are between 0.7 and 0.9 and at other locations in the cleanroom, the VE value will be better than which is normally acceptable.
Other diffuser performance experiments 8,9 showed that different diffusers mix and dilute the air differently resulting in different VE values. By considering the ventilation effectiveness values, the previous equations 3 (for small particles not influenced by gravity) and 4 (larger particles influenced by gravity, such as MCPs) can be modified as shown in Equations 6 and 7 respectively.
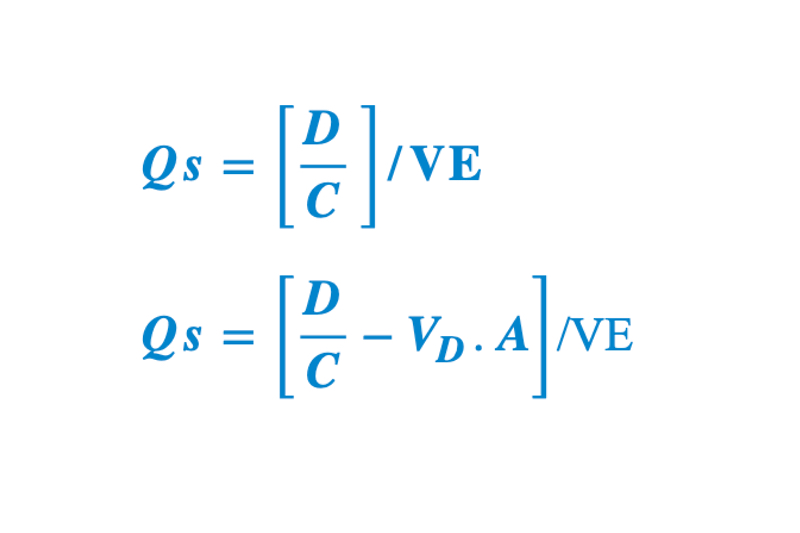
Equation 6 and 7
![Table 1: Maximum concentrations for total particles ≥0.5μm and ≥0.5μm and MCPs, EU Grade C cleanroom [Operational]](/calculating-supply-airflow-rates-using-simple-8.jpg)
Table 1: Maximum concentrations for total particles ≥0.5μm and ≥0.5μm and MCPs, EU Grade C cleanroom [Operational]
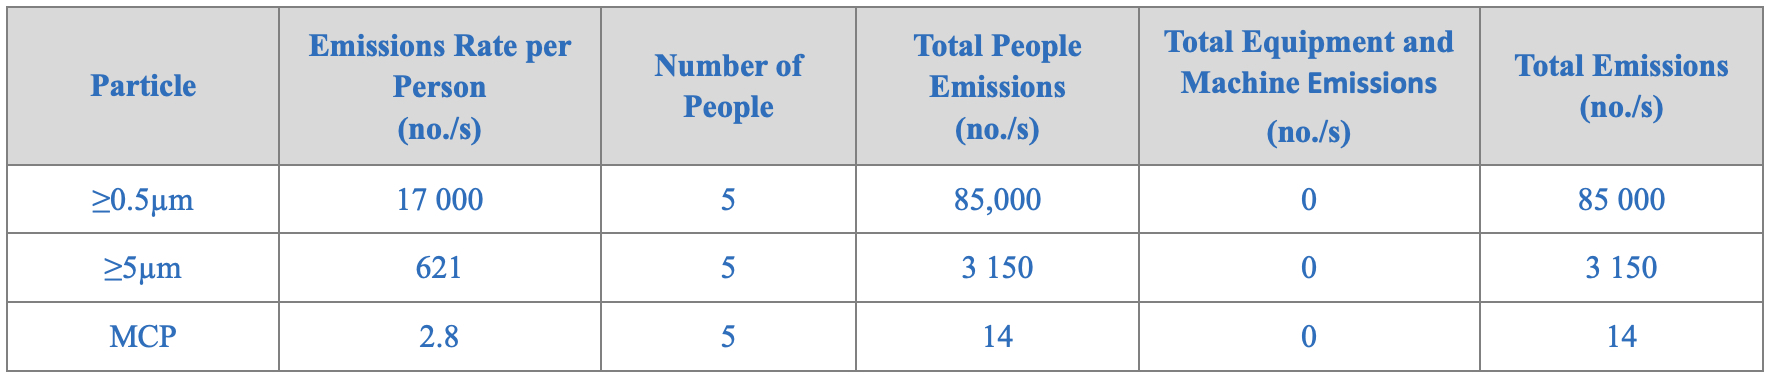
Table 2: Cleanroom emissions for total particles ≥0.5µm and ≥0.5µm and MCPs
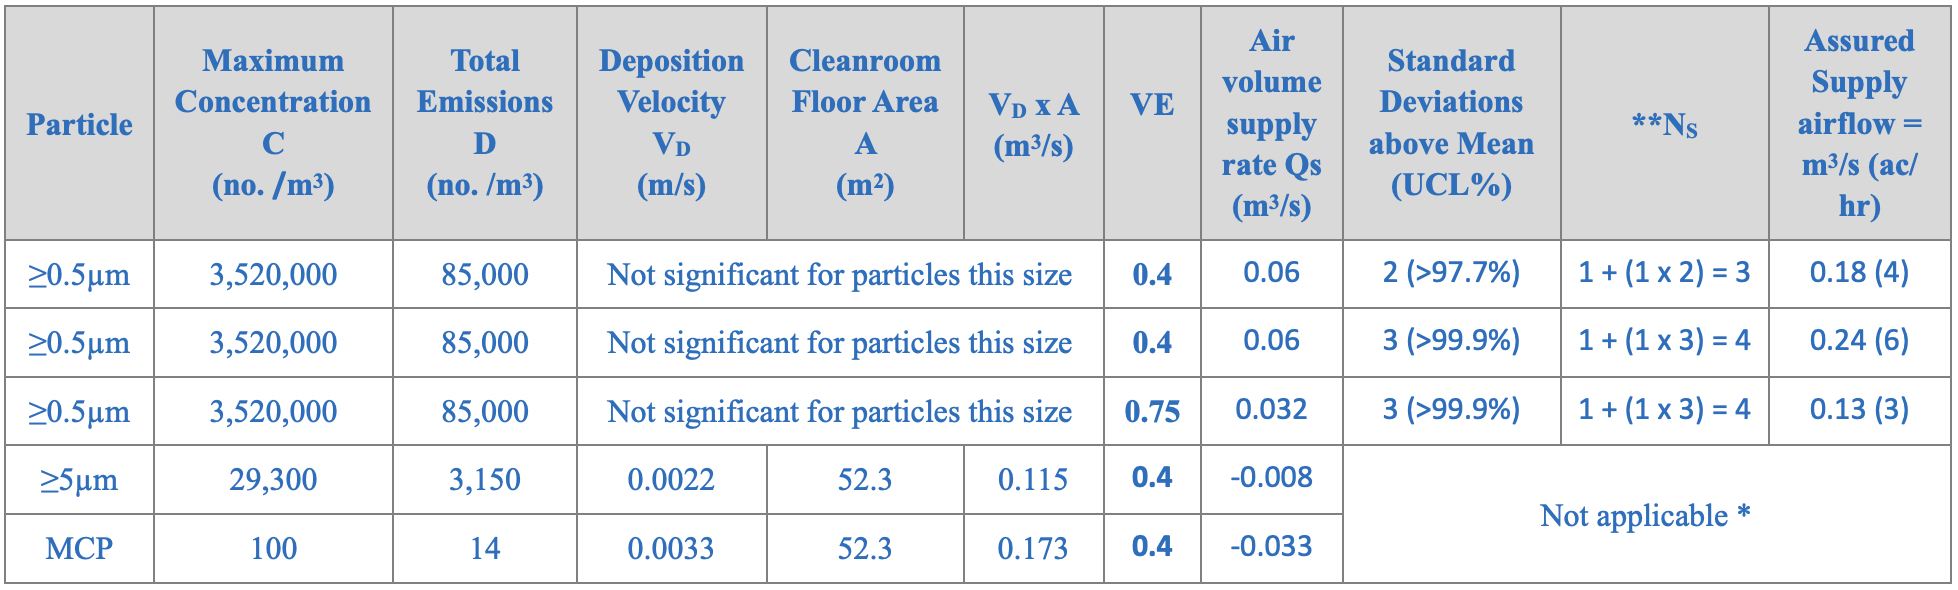
Table 3: Calculated air supply rates required to control emissions to maximum concentration levels || *The maximum airborne concentrations of particles ≥5µm and MCPs will be controlled by gravitational deposition and no additional air supply is required **Any suitable UCL can be chosen and the number of standard deviations that correspond to the UCL, i.e. the Z-value, for a one-sided normal distribution can be readily obtained. If an appropriate UCL is chosen, then the required increase in the supply to control at a maximum concentration instead of an average can be determined using Ns = 1 + Cv x r. Ns = number of times the supply airflow rate to be increased to control at a maximum concentration for a chosen UCL Cv = coefficient of variation (shown to be between 0.5 and 2 with 1 being a common value18) r = number of standard deviations above the mean that corresponds to the chosen UCL, 2 standard deviations contain 97.7%
With simple perforated plate diffusers, which are well spaced out and ceiling extraction suggests the VEI will be poor with a value of about 0.4 (CFD can be used to verify) and may be used for all particle sizes (this could be improved and enhance VEI by using better diffusers which provide more mixing and having low level extraction to flush out contamination). A coefficient of variation of 1 is a reasonable value to utilise and the required air supply to control the emissions to the maximum particle concentrations can be calculated using equations 6 and 7 and are shown in table 3 for particles ≥0.5µm, ≥5µm and MCPs.
Breaking down the numbers
It can be seen that the calculated air supply rate is influenced by the upper confidence limit that in any location within the cleanroom the values will be at or below the maximum allowable value.
Typically, 97.7% UCL, 2 standard deviations above the mean is adequate for this grade of cleanliness and yield a supply airflow of 0.18m3/s. Increasing this UCL to 99.9% yields 0.24m3/s. Compared with a supply rate of 0.87 m3/s resulting from simply using 20 air changes per hour, it can be seen that 0.87m3/s is 363% greater than the supply air flow rate needed to ensure a UCL of ≥99.9%, and this is a poorly ventilated cleanroom with a ventilation effectiveness of 0.4.
If for example, VEI was improved to be 0.75, then only 0.13m3/s of supply would be needed, equating to 3 ac/hr. In this case, 20 ac/hr would be 667% greater.
Overall, the scientific approach more accurately matches the required air supply rate with the defined airborne cleanliness levels with a significantly reduced rate compared to that associated with the unconsidered application of 20 air changes per hour
Overall, the scientific approach more accurately matches the required air supply rate with the defined airborne cleanliness levels with a significantly reduced rate compared to that associated with the unconsidered application of 20 air changes per hour.
Yet further improvements could be made to the ventilation design, by using diffusers which provide better mixing and dilution and low-level extraction to help flush contamination from the cleanroom which would enhance ventilation effectiveness VEI to around 0.75 rather than 0.4. It is accepted that using arbitrary air-change rates as a basis for determining supply airflow rates is simple, easy, and quick, but this solution may therefore result in over-design or, conversely, may result in insufficient supply air, project delay and risk to product quality and patient safety.
It is also accepted that the scientific approach is more complicated, takes longer, and requires data for particle emissions from people, equipment, and processes, which are experimentally derived although the availability of this data is becoming increasingly more available. Additionally, some assumptions must be made regarding other key parameters, such as ventilation effectiveness and coefficient of variation but reasonable assessments can be provided by the appropriately knowledge personnel and complemented by other technologies such as computational fluid dynamics. However, all assumptions should be carefully considered, and suitably safe values agreed to ensure all control requirements can be achieved.
In conclusion
A science-based approach, based upon the correct parameters associated with effective control of airborne contamination control to determining the required air supply rate for non-UDAF cleanrooms is a more appropriate than assigning an unconsidered cleanroom air change rate.
With the appropriate expertise and experience, this will help to ensure that over-design or, conversely, a lack of air supply, are avoided and this presents the opportunity for considerable energy savings whilst maintaining appropriate environmental control.
Correlations of this science-based approach with the actual resultant cleanroom performance would also be useful in order to endorse the methodology.


