Some users believe it is necessary to divide the particle counts of non-volumetric particle counters by the counting efficiency (CE) at the lower limit to establish the “true” concentration of particles in the fluid system.
Other users do not understand why two, similar-sized channels of particle counters with different detection limits do not report the same value.
Understanding counting efficiency is essential for interpreting particle count data accurately
This paper will discuss the science behind these differences and alleviate concerns that come from the characteristics of non-volumetric particle counters.
Key definitions
To fully understand particle counting, it’s essential to grasp the key definitions outlined below:
- Instrument Sample Volume: The volume per unit time of fluid being inspected for particles.
- Instrument Flow Rate: The volume per unit time of fluid passing through the instrument.
- Sample Volume Percentage: Calculated as the instrument sample volume divided by the instrument flow rate, expressed as a percentage.
Understanding particle counters: exploring counting efficiency and comparison
Particle counting technology plays a crucial role in various industries, particularly in sectors like semiconductor manufacturing where maintaining clean fluid systems is paramount.
However, there are nuances in particle counting methodologies that often lead to confusion among users.
The discrepancies between channels of similar-sized particle counters stem from the inherent design differences and operational principles
One such area of contention revolves around the concept of counting efficiency (CE) and the disparities observed between similar-sized channels of particle counters with different limits of detection.
In this comprehensive article, we discuss the intricacies of particle counting technology, focusing on the science behind these differences and addressing concerns surrounding non-volumetric particle counters.
Counting efficiency: a fundamental metric in particle counting
At the heart of understanding particle counting lies the concept of counting efficiency (CE), which represents the percentage of particles detected in the fluid flow relative to the concentration of particles present.
Counting efficiency (CE) serves as a critical metric in evaluating the performance of particle counters, particularly in delineating the true concentration of particles in a fluid system.
Understanding CE is essential for interpreting particle count data accurately and making informed decisions regarding system maintenance and cleanliness protocols.
One crucial phenomenon that influences counting efficiency is sample volume growth
The figure below shows an idealised curve where there is a linear increase in counting efficiency (CE). Within a particle counter, the 20 nm channel is designated to count particles ranging in size from 20 nm to 50 nm.
As the size of particles increases along this channel, there's an observed augmentation in counting efficiency.
Since the counting efficiency increases across the channel as particle size increases, it would not be accurate to divide by the counting efficiency measured at 20 nm to determine the real counts of this channel.
Volumetric vs non-volumetric particle counters
Particle counters can be broadly categorised into two types: volumetric and non-volumetric.
In volumetric particle counters, the sample volume percentage is 100%, meaning the entire fluid passing through the instrument is inspected for particles.
Particle counters can be broadly categorised into two types: volumetric and non-volumetric
On the other hand, non-volumetric particle counters have a sample volume percentage less than 100%, resulting in certain limitations and nuances in particle detection.
Non-volumetric counters, while effective in detecting particles, introduce complexities due to variations in sample volume and counting efficiency.
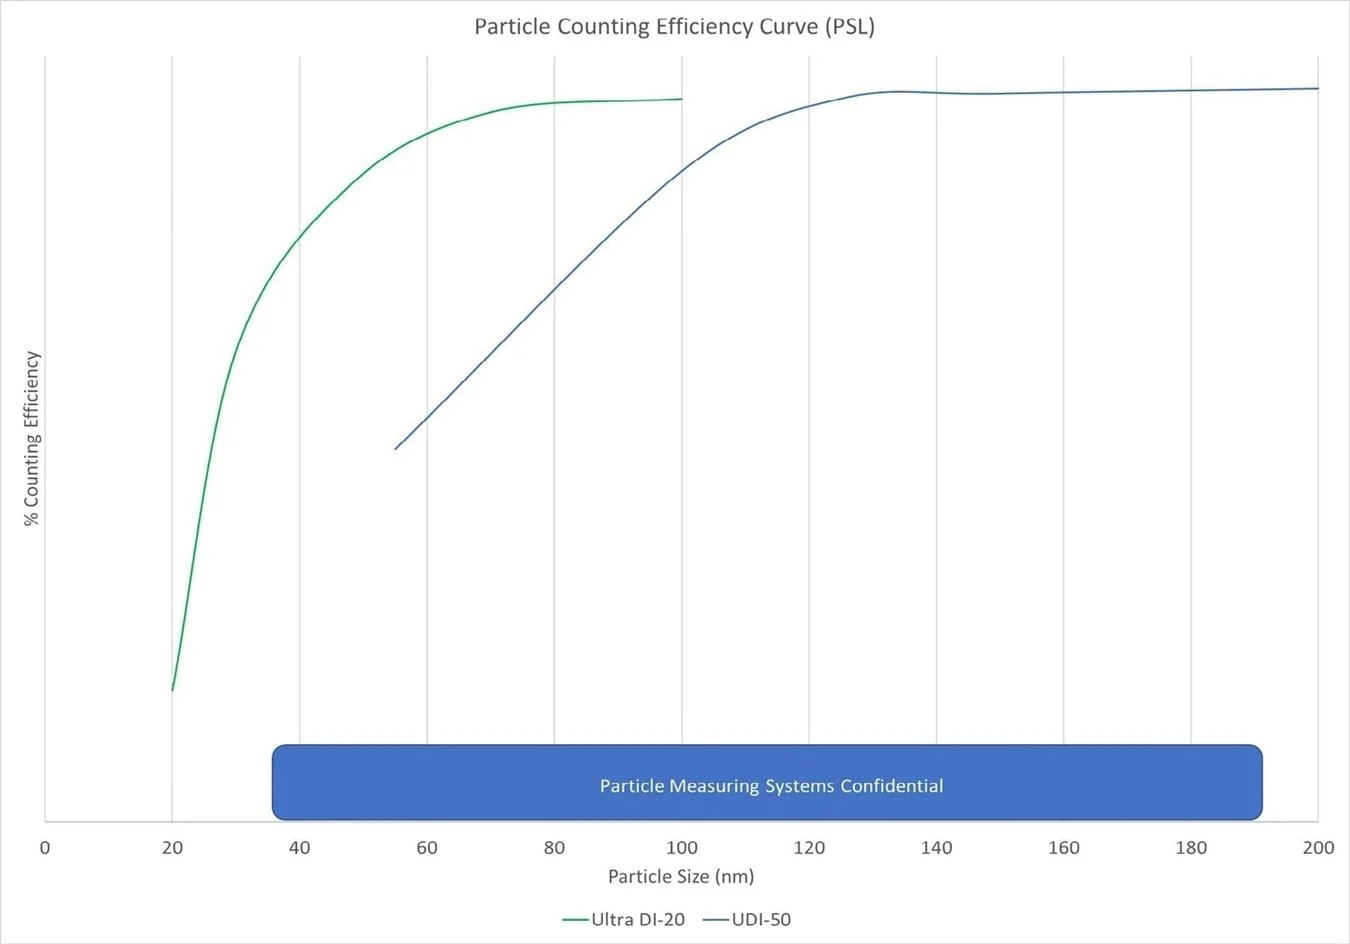
Figure 2: A sensitvity comparison of the UDI-20 particle counter for particles larger than 50nm compared to the UDI-50 counterpart
Figure 2 illustrates that the UDI-20 particle counter, being more sensitive, exhibits a notably higher counting efficiency for particles larger than 50nm compared to the UDI-50 counterpart.
As a result, one would expect the UDI-20 to register more particles in this size range than the UDI-50. However, the discrepancy between these two particle counters in these channels should not raise concerns.
Despite their differing counts, the relationship between the data reported by each remains consistent amidst changes in the system.
One crucial phenomenon that influences counting efficiency is sample volume growth
For instance, if the system becomes dirtier, the particle counts at 50nm would increase on both instruments, and conversely, if the system becomes cleaner, the counts would decrease on both.
While the channels maintain their relative relationships with the system, they inherently measure particles differently due to their design.
The channels maintain their relative relationships with the system, but, by design, measure those particles differently.
Understanding the science behind discrepancies
The discrepancies observed in particle counts between channels of similar-sized particle counters stem from the inherent design differences and operational principles of these instruments.
In non-volumetric particle counters, the process of illuminating the sample cell walls introduces complexities, particularly when dealing with particles smaller than 100 nm.
To mitigate noise levels, the laser must be focused to a size smaller than the sample cell, leading to a region of variable power density.
A common misconception among users is the notion of "correcting" counting efficiency to establish the "true" particle counts
This variability in beam intensity affects the detection and sizing of particles, leading to differences in reported counts.
Understanding these nuances is crucial for accurately interpreting particle count data and making informed decisions based on system cleanliness and integrity.
Sample volume growth: a key phenomenon
One crucial phenomenon that influences counting efficiency is sample volume growth, where the instrument sample volume increases with particle size.
Certain particles have the opportunity to pass through the central region of the laser beam, where the energy concentration is highest (as depicted in the figure below).
These particles will yield a robust signal, indicating a larger size upon measurement.
Conversely, particles of identical size traversing closer to the edges of the beam, where energy levels diminish significantly, will generate a weaker signal, leading to a measurement indicative of a smaller particle size.
Larger particles have a higher likelihood of transiting through regions of the laser beam with higher energy, resulting in a stronger signal and accurate detection.
Through continued research and awareness, the field of particle counting will continue to evolve
It’s important to note that particles at the detection limit of the particle counter can only be identified when passing through the centre of the laser beam.
However, larger particles possess the capability to produce a signal equivalent to that of a particle at the detection limit when passing through sections of the beam farther from its centre.
Consequently, these larger particles may be categorised and counted as smaller particles.
This phenomenon, inherent in all non-volumetric particle counters, underscores the complexities involved in accurately assessing particle concentrations.
By understanding sample volume growth and its implications on counting efficiency, users can better interpret particle count data and identify trends within their fluid systems.
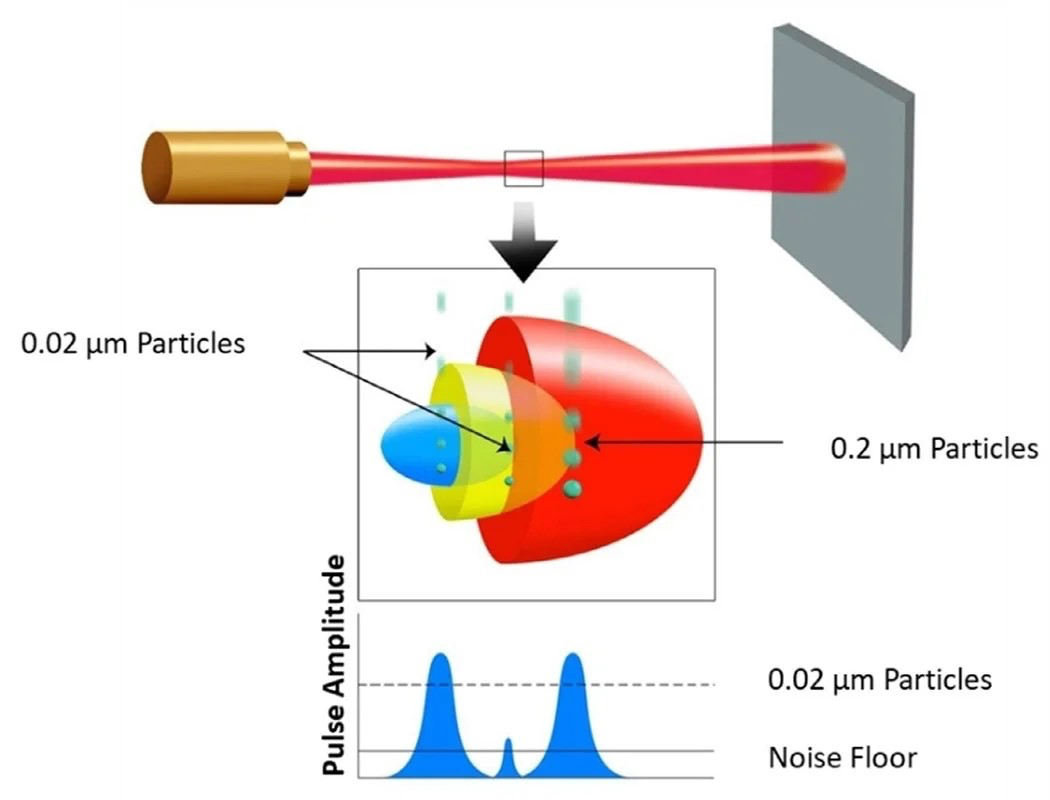
Figure 3: Certain particles have the opportunity to pass through the central region of the laser beam
Addressing concerns and misconceptions
A common misconception among users is the notion of "correcting" counting efficiency to establish the "true" particle counts.
However, the counting efficiency measured at the lower detection limit is not indicative of the entire channel's efficiency.
Conversely, particles of identical size traversing closer to the edges of the beam
Attempting to correct for this discrepancy often leads to inaccuracies and misinterpretations of particle count data. Instead, users should focus on understanding the inherent limitations and nuances of their particle counters and interpret data within the context of these factors.
By acknowledging these complexities, users can make more informed decisions regarding system cleanliness and maintenance.
Comparing particle counters: understanding differences
When comparing particle counters with different limits of detection, it's essential to consider the inherent differences in counting efficiency.
While discrepancies may exist in reported counts between channels of varying sensitivity, the trends remain consistent across both instruments.
A common misconception among users is the notion of "correcting"
Understanding the underlying principles of sample volume growth and counting efficiency elucidates why these differences occur and underscores the importance of interpreting data in context.
By recognising these differences, users can confidently analyse particle count data and make informed decisions regarding system maintenance and optimisation efforts.
Conclusion
Particle counting technology plays a pivotal role in ensuring the cleanliness and integrity of fluid systems across various industries.
However, nuances such as counting efficiency and differences between particle counters can pose challenges for users.
By understanding the underlying science and principles governing particle counting, users can navigate these complexities more effectively, ensuring accurate interpretation of data and informed decision-making in system maintenance and optimisation efforts.
Through continued research and awareness, the field of particle counting will continue to evolve, providing users with increasingly reliable and accurate tools for monitoring and maintaining fluid system cleanliness.