
Trigger sprays are a convenient way to dispense disinfectants but not all sprays are the same. James Tucker,1 Neil Simpson2 and Steve Moss3 outline a study used to show that some trigger systems are affected by suck-back.
The new SteriShield Delivery System safeguards the continued sterility of the contents of trigger spray bottles by eliminating the risks associated with ‘suck-back’. In a conventional trigger spray suck- back allows potentially contaminated air into the bottle, which can in turn contaminate the liquid inside. Since its introduction, the system has been widely used to protect successfully the integrity of sterile alcohols, biocides and neutral detergents in trigger spray presentations for pharmaceutical applications.
A validation study was designed to explore the potential risk of contamination being brought into a system via the only possible point of entry, the trigger head. The study compared the number of 0.5µm and 5µm particles drawn into various trigger systems, including the SteriShield Delivery System trigger, during use to present a quantified assessment of the risks from suck-back.
The new trigger system has two main component parts: the bottle with a co-extruded integral Surlyn bag, and the trigger head. The liquid is held inside the bag and the function of the bottle is simply to enclose and protect the bag in use.
The trigger head operates as a non-venting type, but has unique features with patents pending. The trigger drives a piston in the chamber of the trigger head. When the trigger is squeezed, the liquid in the chamber is forced out of the spray nozzle while a non-return valve prevents liquid going back down the dip tube. When the trigger is released, the resulting suction draws the liquid from the bag via the dip tube into the chamber ready for the next squeeze.
The integral bag collapses as the liquid is used and a vacuum is formed, ensuring that all the contents can be dispensed. Two small holes in the base of the bottle allow the air pressure to equalise with ambient, thereby preventing the bottle from collapsing.
The only point of entry into the bag is via the dip tube, which is completely sealed by the trigger head, thereby creating a closed system. This prevents any air being drawn back into the liquid in the bag when the trigger mechanism is operated.
By contrast, in a conventional trigger spray bottle, there is no bag and the trigger spray head is of the venting type so as to allow air back into the bottle to replace the liquid drawn up. Again, this is to prevent the bottle collapsing, but in this case the liquid is in the bottle, so can be contaminated by the air drawn in.
study protocol
The development of the new trigger led to an investigation into whether there were more stringent ways of validating it than the media test alone. The two standard ways of monitoring contamination in a cleanroom are by particle counts and by media tests. It was therefore decided to include particle counts as part of the validation.
The objective of the test was to ascertain what is actually happening to the air within the bag while it is in use, i.e. does any outside air get drawn in, thereby creating a potential chance of contamination?
It is not possible to place a particle counter inside the bag to check for airborne contamination but it is possible to create a sealed test system for the trigger spray head by sealing it onto a special test bottle. The air from inside the special test bottle can then be passed through a remote particle counter, to see if contamination has entered via the trigger spray head.
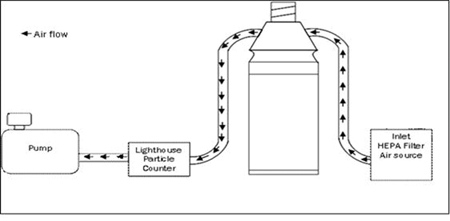
Figure 2: Diagram of test set-up
Test method: A 1-litre bottle was set up with a HEPA filtered inlet and an outlet connected to a Lighthouse Remote 5104 particle counter and an air pump via tubing as illustrated in Figure 2. The HEPA filtered inlet was necessary to prevent the collapse of the bottle. Air was drawn through the system at a rate of 1ft3/min.
Background count: The test system was first of all set up without a trigger head in place, i.e. with the bottle neck open (Figure 3), and three samples were taken for a period of one minute each. The data from these samples indicated the potential airborne contamination challenge level at the bottle neck at the start of the testing (Table 1).
| Table 1: Background count (pre-testing) | |||
| ≥0.5µm particles/m3 | ≥5µm particles/m3 | 2008 | |
| Test 1 | |||
| Test 2 | |||
| Test 3 | |||
Following the testing, the three background counts (with the trigger head removed again) were repeated to confirm the process had not cleaned up the testing environment (Table 2). This was not possible with Trigger Z as it had a tamperproof neck. However, counts were taken with a new bottle at each trigger change and at the end of the process.
| Table 2: Background count (post testing) | |||
| ≥0.5µm particles/m3 | ≥5µm particles/m3 | 2008 | |
| Test 1 | |||
| Test 2 | |||
| Test 3 | |||
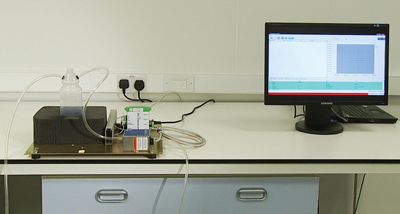
Figure 3: Bottle connected to the particle counter with bottle neck open
Test system with trigger: The trigger under test was attached to the bottle (Figure 3) and air pulled through the system via the pump until a zero count was reached showing the air inside the bottle was now completely clean. The trigger was then used for approximately one minute with the same number of actuations that would be required to remove 100ml of liquid. (The number of actuations was calculated from the dispense volume of the trigger). The particle count reading for this one minute period was noted.
The system was then left with the pump running but the trigger not being used in order to allow the air in the bottle to clean up (at rest result). Once a zero count had been achieved, usually within the next minute, the test could be repeated. The air was then allowed to clean up again and the test repeated.
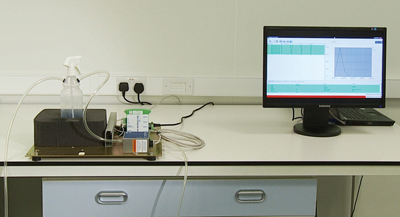
Figure 4: Bottle connected to the particle counter with trigger head under test in place
For each trigger type a sample size of three trigger heads was used. For each trigger head the test was repeated three times giving a total of nine results per trigger type.
The following tests were carried out:
- Negative control – non-venting trigger heads from two different manufacturers, triggers A and B. A non-venting trigger is designed so no air passes through the trigger at all – in effect the trigger is acting as a cap on the bottle. This test was to show that the test system was leak-tight and no background air could get into the system in any way (other than through a faulty or venting trigger head) (Table 3).
- Positive control – standard venting trigger heads from two different manufacturers, triggers P and Q. A standard venting trigger allows air to return into the bottle to prevent it from collapsing. This test was to show that if background air is getting in then the test system can detect it (Table 4).
- The new SteriShield Delivery System, which acts as a non-venting trigger head. This test was to show that no air can be drawn back into the liquid when using the new system (Table 5). Two different batches of trigger head were used.
- Trigger heads used by other suppliers to the life science cleanroom market, triggers X and Y. This test was to compare the performance of competitive products (Table 6) and the SteriShield Delivery System. Upon inspection, trigger X was non-venting, trigger Y was found to have a venting hole and trigger Z was also a venting trigger with, it was claimed, a filter for the returning air.
| Table 3: Negative controls – non-venting triggers | ||||||
| Test 1 | Test 2 | Test 3 | Test 1 | Test 2 | Test 3 | |
| Trigger A1 | 1.1 | 0 | 0 | 0 | 0 | 0 |
| Trigger A2 | 0 | 0 | 0 | 0 | 0 | 0 |
| Trigger A3 | 0 | 0 | 0 | 0 | 0 | 0 |
| Test 1 | Test 2 | Test 3 | Test 1 | Test 2 | Test 3 | |
| Trigger B1 | 1.1 | 0 | 0 | 0 | 0 | 0 |
| Trigger B2 | 0 | 0 | 0 | 0 | 0 | 0 |
| Trigger B3 | 0 | 0 | 2.1 | 0 | 0 | 0 |
| Table 4: Positive controls – standard-venting triggers | ||||||
| Test 1 | Test 2 | Test 3 | Test 1 | Test 2 | Test 3 | |
| Trigger P1 | 1,021 | 774 | 821 | 2.1 | 2.1 | 0 |
| Trigger P2 | 1,466 | 1,281 | 951 | 0 | 0 | 0 |
| Trigger P3 | 1,080 | 535 | 790 | 1.0 | 0 | 1.0 |
| Test 1 | Test 2 | Test 3 | Test 1 | Test 2 | Test 3 | |
| Trigger Q1 | 2,263 | 2,670 | 1,557 | 5.3 | 8.4 | 4.3 |
| Trigger Q2 | 1,788 | 2,171 | 1,701 | 9.5 | 6.3 | 7.5 |
| Trigger Q3 | 1,450 | 2,680 | 1,667 | 3.2 | 8.4 | 3.2 |
Environment results: The environmental results given in Tables 1 and 2 clearly demonstrate that there was potential for contamination from the background environment. The results are comparable to the EU GMP standard for a Grade D cleanroom.
In addition, the environmental readings at the end of the test work were of a similar level to those at the start. This shows that the test work itself did not change the level of contamination in the background air and that the potential to draw contamination into the system still remained high at the end of the testing (i.e. passing air through the HEPA filters had not purified the air in the background environment enough to reduce the risk of contamination).
Trigger results: Negative control non- venting trigger (Table 3). The negative control results (for non-venting triggers) showed that the test system was operating as a closed system. There were no leaks anywhere in the system that could contribute to air getting into the bottle. So for any other trigger type, if there were particle count readings it had to be because air was getting in through the trigger.
It was the opinion of the particle monitoring equipment manufacturer that fewer than five particles at the 0.5µm size would be as a result of disturbance of any particles within the bottle and should not be attributed to leaks in the system.
Positive control: standard-venting trigger (Table 4). The positive control results (for standard-venting triggers where air can pass through them) clearly show higher counts of particles drawn into the bottle. These results demonstrate that the test system was able to detect background air getting into the bottle. They also confirm earlier work carried out by the company using media tests, which showed that with a conventional trigger spray air does get pulled back into the bottle and therefore into the sterile fluid.
The average results for trigger P were 968.80 ≥0.5µm particles and 0.71 ≥5µm particles. The average results for trigger Q were 1994.31 ≥0.5µm and 6.22 ≥5µm particles. These results are for the number of actuations required to remove 100ml of liquid. Therefore, the results should be multiplied by 10 to show the total contamination in a full 1-litre bottle.
Thus a full 1-litre bottle using trigger P would contain 9,688 ≥0.5µm particles and 7 ≥5µm particles and trigger Q 19,943 ≥0.5µm particles and 62 ≥5µm particles.
SteriShield Delivery System trigger: The SteriShield Delivery System trigger results in Table 5 demonstrate that no air passed through the trigger back into the bottle. Zero particle count results were obtained for each replicate, for each of the three triggers used. Therefore, the trigger does effectively prevent airborne contamination entering the sterile fluid.
Other suppliers’ triggers (Table 6): It is possible to argue that as this was a test of the trigger not the system, there could have been a potential incompatibility between the trigger head and the bottle leading to air getting into the system. However, even though the triggers were different, the actual closure was the same size for all the triggers tested and a good seal was achieved. The fact that the bottle was able to be cleaned up to zero particle counts at rest shows that if any air was getting in it was getting in through the trigger in use and not through the threads on the closure.
| Table 5: New SteriShield Delivery System triggers | ||||||
| Batch 1 | ||||||
| Trigger 1 | 0 | 0 | 0 | 0 | 0 | 0 |
| Trigger 2 | 0 | 0 | 0 | 0 | 0 | 0 |
| Trigger 3 | 0 | 0 | 0 | 0 | 0 | 0 |
| Batch 2 | ||||||
| Trigger 1 | 0 | 0 | 0 | 0 | 0 | 0 |
| Trigger 2 | 0 | 0 | 0 | 0 | 0 | 0 |
| Trigger 3 | 0 | 0 | 0 | 0 | 0 | 0 |
| Table 6: Other triggers on the market (X, Y & Z) | ||||||
| Test 1 | Test 2 | Test 3 | Test 1 | Test 2 | Test 3 | |
| Trigger X1 | 0 | 0 | 0 | 0 | 0 | 0 |
| Trigger X2 | 421 | 15 | 103 | 4.2 | 1.1 | 0 |
| Trigger X3 | 0 | 0 | 0 | 0 | 0 | 0 |
| Trigger Y1 | 249 | 64 | 123 | 0 | 2.1 | 2.1 |
| Trigger Y2 | 368 | 82 | 82 | 24.6 | 0 | 0 |
| Trigger Y3 | 105 | 100 | 150 | 2.1 | 0 | 0 |
| Trigger Z1 | 28 | 26 | 74* | 4 | 4 | 15* |
| Trigger Z2 | 62 | 353 | 56 | 0 | 21 | 8 |
| Trigger Z3 | 189 | 25 | 251 | 21 | 1 | 29 |
*In these two tests it was noted that the trigger and bottle combination were unable to clean up after use. This indicated that the use of the trigger had compromised it permanently. (There was no evidence of any damage to the trigger).
Trigger X was a non-venting trigger. It was therefore not expected to allow any air to be drawn back into the bottle. The results show that this was indeed the case for triggers 1 and 3. However, the unexpected result for trigger 2 suggests that that trigger might have been faulty.
Trigger Y showed a significant number of counts for both 0.5µm and 5µm particles; results were comparable to the positive control, therefore air must have been passing back through the trigger into the bottle potentially compromising any sterile fluid.
Trigger Z showed a significant number of counts for both 0.5µm and 5µm particles giving results comparable to or worse than the positive control. The product was supposed to filter the returning air. However, the air passing back into the bottle through the trigger was not filtered sufficiently to remove particles of concern in a cleanroom environment, therefore potentially compromising any sterile fluid.
The result is for the number of actuations required to remove 100ml of liquid so the results must be multiplied by 5 for triggers X and Z, and by 9 for trigger Y, to take account of the respective bottle volumes so as to give a representative figure for complete evacuation of the product.
This would give an average result of 299 ≥0.5µm particles and 3 ≥5µm particles being pulled back into the sterile fluid for trigger X, 1323 ≥0.5µm particles and 30.6 ≥5µm particles for trigger Y and 591 ≥0.5µm particles and 55 ≥5µm particles for trigger Z.
The results from this validation study show the very real risk of compromising the contents of a sterile trigger spray bottle by the use of a venting trigger system or of an unvalidated non-venting trigger system. This is highlighted by the results from the positive controls, using conventional venting trigger spray heads, and from the tests of other venting and non-venting triggers.
The results from the tests on the supplier Y trigger showed that air could get back into the bottle. This was, therefore, not truly a closed system and could not be relied upon to provide a sterile product throughout use.
The results from the tests on the supplier Z trigger showed that the air was not filtered sufficiently and potential contamination could get back into the bottle. This was, therefore, not a solution to the issue of ‘suck-back’ and could not be relied upon to provide a sterile product throughout use.
The newly developed trigger head used on the SteriShield Delivery System has clearly shown that no air is drawn into the system, therefore preserving the integrity of the contents and providing a sterile product throughout use. These results are further confirmed through conventional media testing on the new trigger, which showed no contamination of the product after three months of rigorous testing.
Contacts
1. James Tucker, Portfolio Manager, Sterile Environmental Hygiene EMEA, Shield Medicare Ltd
2. Neil Simpson, R&D Project Manager, Shield Medicare Ltd
3. Steve Moss, Technical Service Manager, Facility Monitoring Systems (part of the Validair Group).
* The authors would like to acknowledge the assistance given by cleanroom consultant, John Neiger, in compiling this article.

Featured companies
 Ecolab Life Sciences
 is the market leader in the supply of premier contamination control solutions for life science cleanrooms worldwide.
Ecolab Life Sciences
Ecolab Life Sciences is the market leader in the supply of premier contamination control solutions for life science cleanrooms worldwide.
 FMS (Facility Monitoring Systems Limited)
FMS (Facility Monitoring Systems Ltd) provides particle counters, Environmental Monitoring (EM) systems, contamination control expertise and related support services
FMS (Facility Monitoring Systems Limited)
FMS (Facility Monitoring Systems Ltd) provides particle counters, Environmental Monitoring (EM) systems, contamination control expertise and related support services